
- Startseite >
- Flüsse >
- Wasserstand >
- Unterer Main >
- Faulbach >
- Jahresgrafik

Jahresgrafik Faulbach / Main
Wasserstand vom 06.07.2019 bis zum 05.07.2020
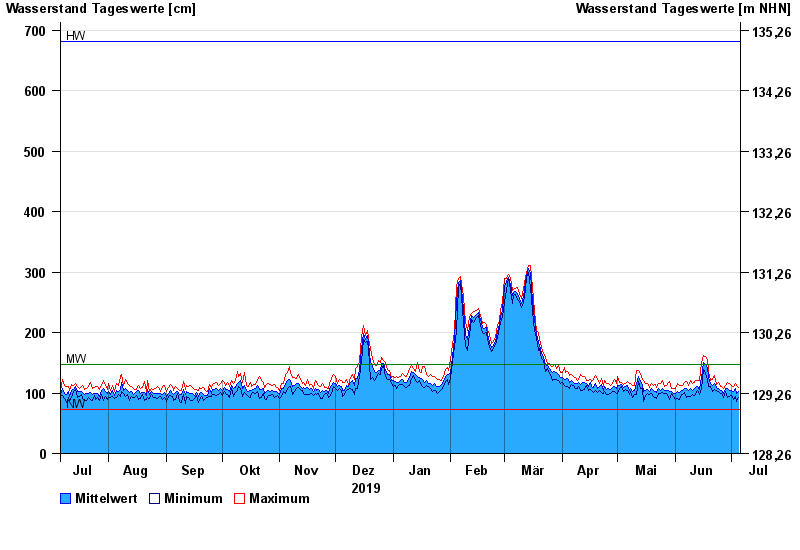
| Datum | Mittelwert [cm] | Maximum [cm] | Minimum [cm] |
|---|---|---|---|
| 05.07.2020 | 103 | 109 | 92 |
| 04.07.2020 | 100 | 112 | 86 |
| 03.07.2020 | 107 | 116 | 95 |
| 02.07.2020 | 103 | 111 | 89 |
| 01.07.2020 | 105 | 113 | 96 |
| 30.06.2020 | 104 | 116 | 95 |
| 29.06.2020 | 107 | 117 | 93 |
© Bayerisches Landesamt für Umwelt 2024