
- Startseite >
- Flüsse >
- Wasserstand >
- Unterer Main >
- Birkenfeld >
- Jahresgrafik

Jahresgrafik Birkenfeld / Aisch
Wasserstand vom 29.03.2024 bis zum 28.03.2025
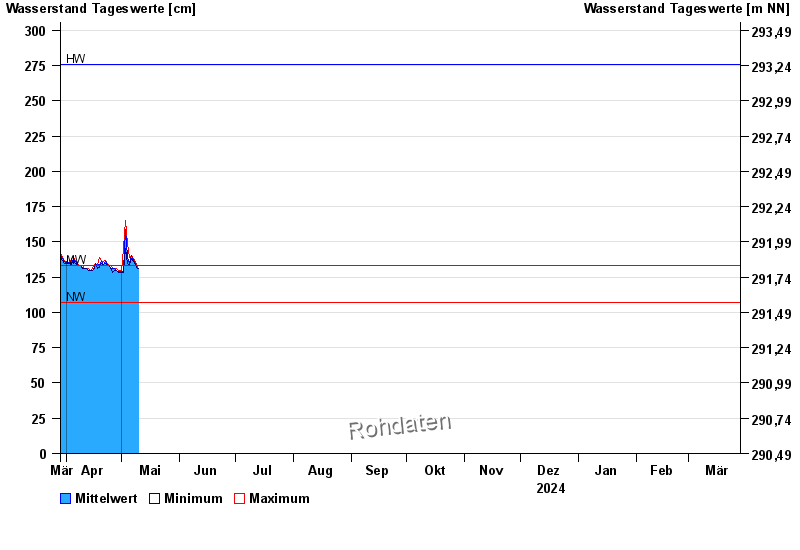
| Datum | Mittelwert [cm] | Maximum [cm] | Minimum [cm] |
|---|---|---|---|
| 10.05.2024 | 131 | 131 | 131 |
| 09.05.2024 | 132 | 133 | 132 |
| 08.05.2024 | 135 | 136 | 134 |
| 07.05.2024 | 137 | 138 | 136 |
| 06.05.2024 | 140 | 140 | 138 |
| 05.05.2024 | 135 | 139 | 134 |
| 04.05.2024 | 139 | 149 | 135 |
© Bayerisches Landesamt für Umwelt 2024