
- Startseite >
- Flüsse >
- Wasserstand >
- Unterer Main >
- Binzwangen >
- Jahresgrafik

Jahresgrafik Binzwangen / Altmühl
Wasserstand vom 29.10.2019 bis zum 28.10.2020
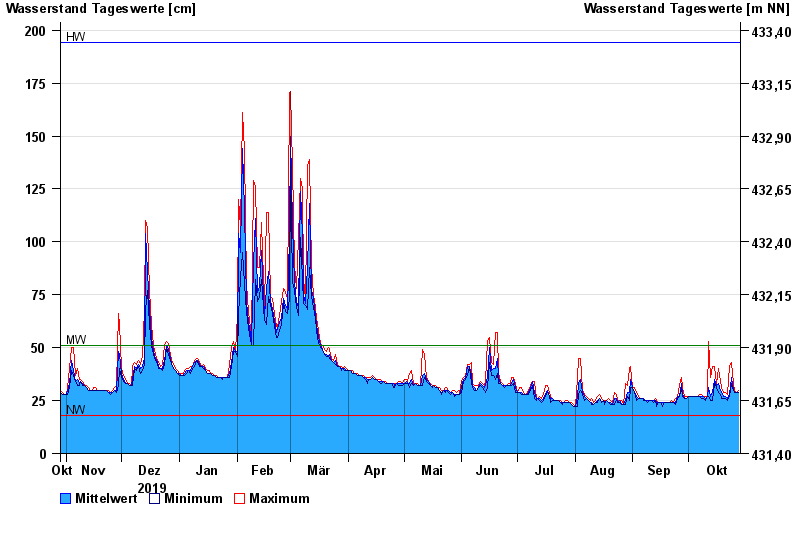
Hinweis
Wasserstand und Abfluss wird zeitweise durch Biberdamm beeinflusst.
| Datum | Mittelwert [cm] | Maximum [cm] | Minimum [cm] |
|---|---|---|---|
| 28.10.2020 | 29 | 30 | 29 |
| 27.10.2020 | 29 | 29 | 29 |
| 26.10.2020 | 29 | 30 | 29 |
| 25.10.2020 | 30 | 33 | 30 |
| 24.10.2020 | 36 | 43 | 33 |
| 23.10.2020 | 28 | 41 | 27 |
| 22.10.2020 | 26 | 28 | 25 |
© Bayerisches Landesamt für Umwelt 2024