
- Startseite >
- Flüsse >
- Wasserstand >
- Unterer Main >
- Astheim >
- Jahresgrafik

Jahresgrafik Astheim / Main
Wasserstand vom 25.07.2022 bis zum 24.07.2023
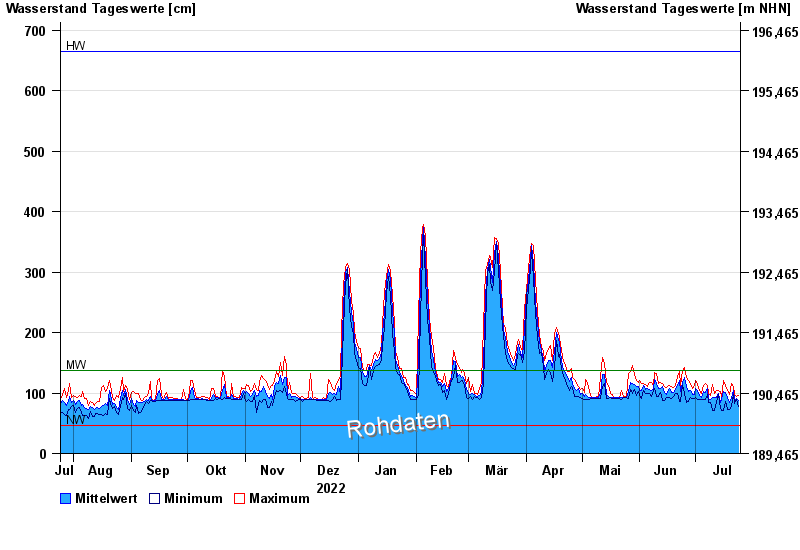
| Datum | Mittelwert [cm] | Maximum [cm] | Minimum [cm] |
|---|---|---|---|
| 24.07.2023 | 88 | 96 | 78 |
| 23.07.2023 | 91 | 95 | 89 |
| 22.07.2023 | 88 | 98 | 83 |
| 21.07.2023 | 105 | 110 | 98 |
| 20.07.2023 | 93 | 115 | 78 |
| 19.07.2023 | 85 | 98 | 73 |
| 18.07.2023 | 92 | 104 | 72 |
© Bayerisches Landesamt für Umwelt 2024