
- Startseite >
- Flüsse >
- Wasserstand >
- Unterer Main >
- Astheim >
- Jahresgrafik

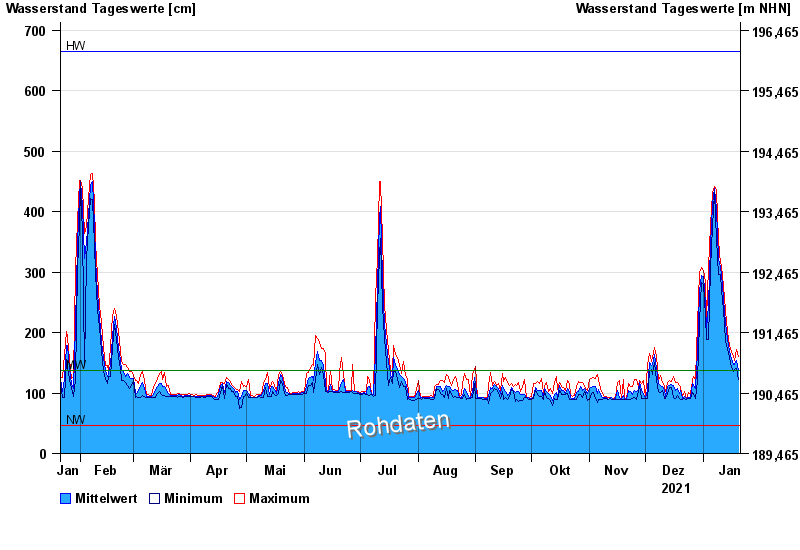
Jahresgrafik Astheim / Main
Wasserstand vom 21.01.2021 bis zum 20.01.2022
| Datum | Mittelwert [cm] | Maximum [cm] | Minimum [cm] |
|---|---|---|---|
| 20.01.2022 | 138 | 161 | 122 |
| 19.01.2022 | 154 | 172 | 140 |
| 18.01.2022 | 147 | 154 | 139 |
| 17.01.2022 | 148 | 161 | 135 |
| 16.01.2022 | 157 | 169 | 142 |
| 15.01.2022 | 168 | 178 | 158 |
| 14.01.2022 | 189 | 201 | 173 |
© Bayerisches Landesamt für Umwelt 2024