
- Startseite >
- Flüsse >
- Wasserstand >
- Unterer Main >
- Astheim >
- Jahresgrafik

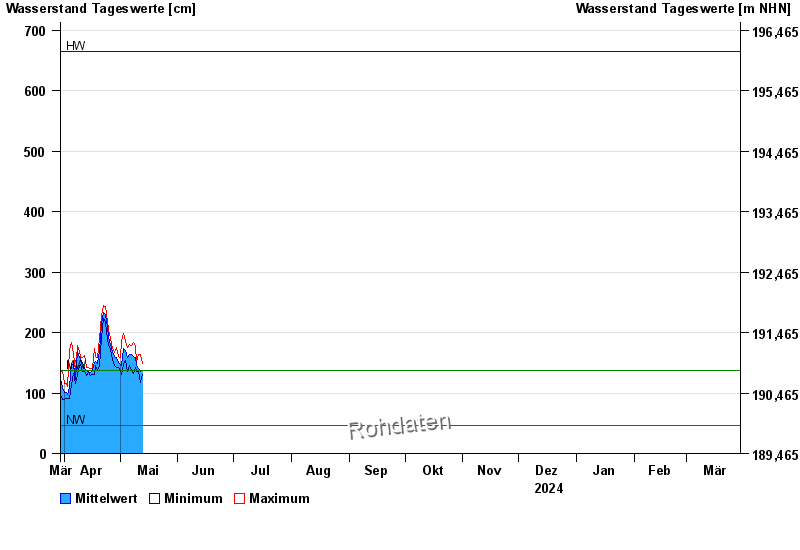
Jahresgrafik Astheim / Main
Wasserstand vom 30.03.2024 bis zum 29.03.2025
| Datum | Mittelwert [cm] | Maximum [cm] | Minimum [cm] |
|---|---|---|---|
| 28.04.2024 | 164 | 167 | 159 |
| 27.04.2024 | 167 | 174 | 156 |
| 26.04.2024 | 180 | 190 | 172 |
| 25.04.2024 | 192 | 205 | 180 |
| 24.04.2024 | 209 | 219 | 189 |
| 23.04.2024 | 230 | 243 | 216 |
| 22.04.2024 | 233 | 244 | 224 |
© Bayerisches Landesamt für Umwelt 2024