
- Startseite >
- Flüsse >
- Wasserstand >
- Unterer Main >
- Astheim >
- Jahresgrafik

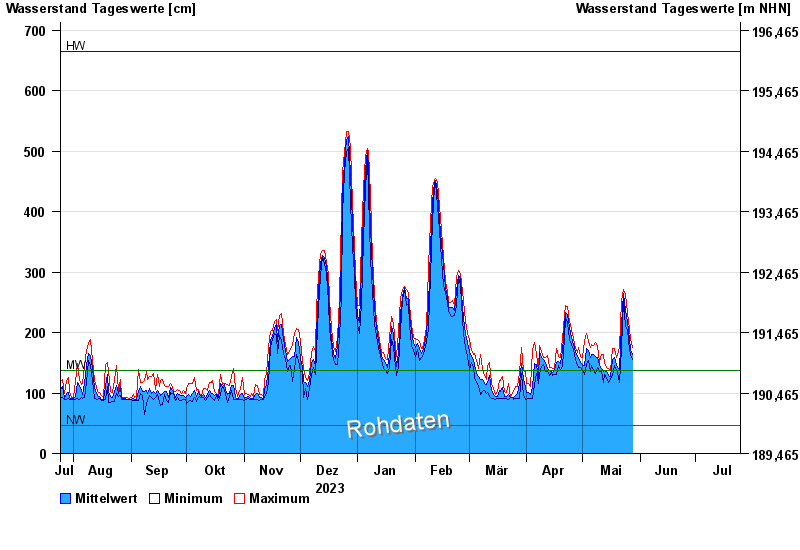
Jahresgrafik Astheim / Main
Wasserstand vom 25.07.2023 bis zum 24.07.2024
| Datum | Mittelwert [cm] | Maximum [cm] | Minimum [cm] |
|---|---|---|---|
| 29.05.2024 | 159 | 167 | 152 |
| 28.05.2024 | 162 | 176 | 151 |
| 27.05.2024 | 172 | 190 | 164 |
| 26.05.2024 | 188 | 205 | 172 |
| 25.05.2024 | 219 | 233 | 204 |
| 24.05.2024 | 236 | 263 | 210 |
| 23.05.2024 | 264 | 271 | 254 |
© Bayerisches Landesamt für Umwelt 2024