
- Startseite >
- Flüsse >
- Wasserstand >
- Unterer Main >
- Astheim >
- Jahresgrafik

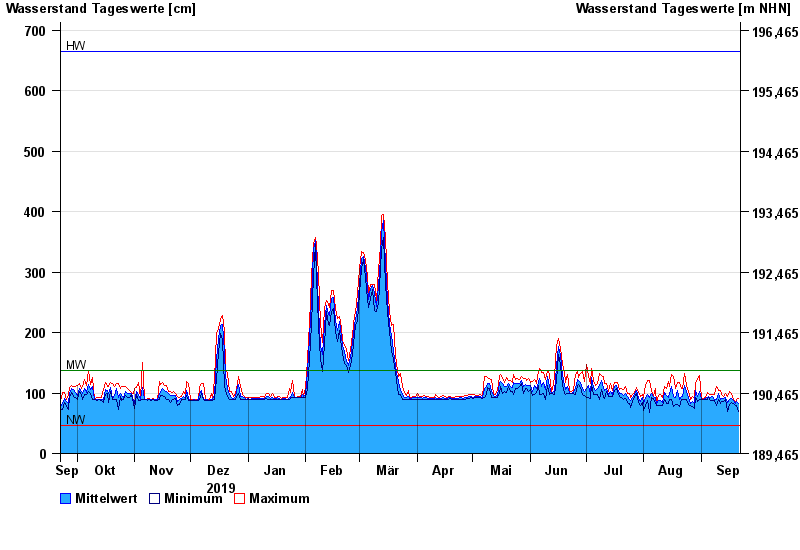
Jahresgrafik Astheim / Main
Wasserstand vom 22.09.2019 bis zum 21.09.2020
| Datum | Mittelwert [cm] | Maximum [cm] | Minimum [cm] |
|---|---|---|---|
| 21.09.2020 | 83 | 91 | 69 |
| 20.09.2020 | 86 | 89 | 79 |
| 19.09.2020 | 82 | 85 | 79 |
| 18.09.2020 | 87 | 90 | 82 |
| 17.09.2020 | 91 | 99 | 85 |
| 16.09.2020 | 89 | 102 | 81 |
| 15.09.2020 | 85 | 94 | 70 |
© Bayerisches Landesamt für Umwelt 2024