
- Startseite >
- Flüsse >
- Wasserstand >
- Obere Donau >
- Winkl >
- Jahresgrafik

Jahresgrafik Winkl / Verlorener Bach
Wasserstand vom 01.01.2024 bis zum 31.12.2024
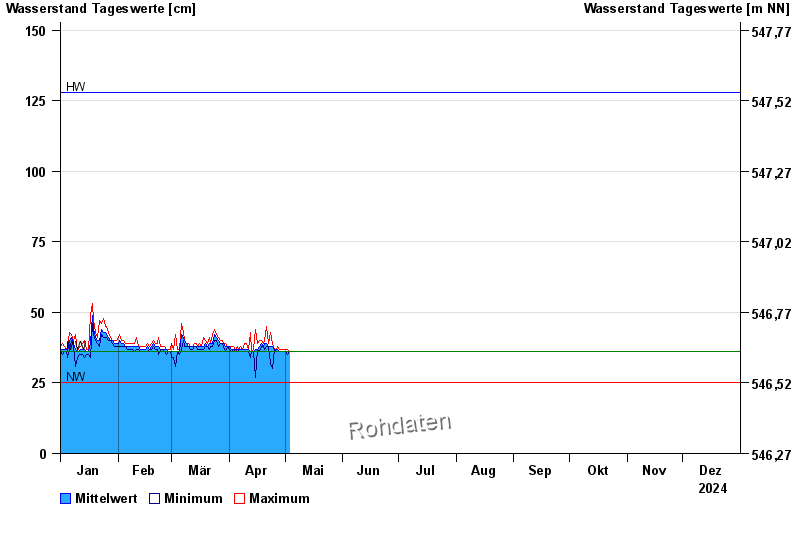
Hinweis
Messwerte beeinflusst durch Kraftwerkssteuerungen.
| Datum | Mittelwert [cm] | Maximum [cm] | Minimum [cm] |
|---|---|---|---|
| 27.05.2024 | 37 | 39 | 36 |
| 26.05.2024 | 37 | 37 | 37 |
| 25.05.2024 | 39 | 45 | 37 |
| 24.05.2024 | 37 | 45 | 36 |
| 23.05.2024 | 36 | 39 | 34 |
| 22.05.2024 | 36 | 37 | 34 |
| 21.05.2024 | 36 | 37 | 35 |
© Bayerisches Landesamt für Umwelt 2024