
- Startseite >
- Flüsse >
- Wasserstand >
- Obere Donau >
- Weiboldshausen >
- Jahresgrafik

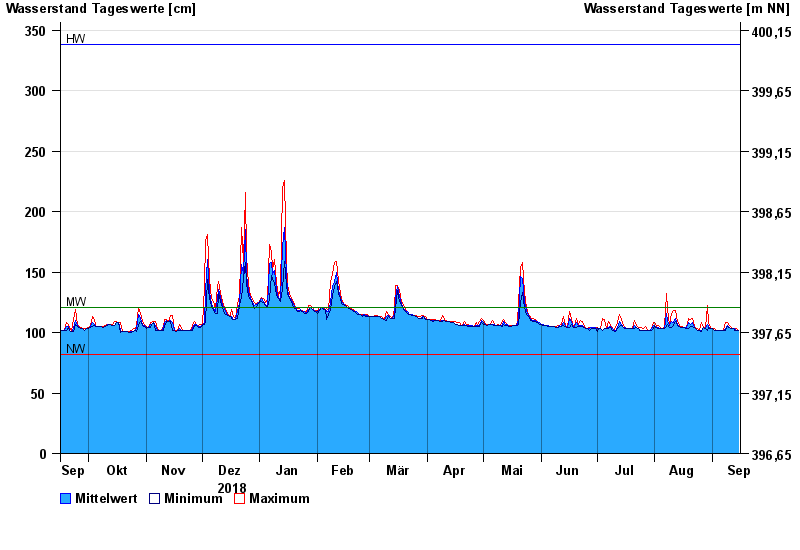
Jahresgrafik Weiboldshausen / Felchbach
Wasserstand vom 16.09.2018 bis zum 15.09.2019
Hinweis
Wasserstand und Abfluss wird zeitweise durch Biberdamm beeinflusst.
| Datum | Mittelwert [cm] | Maximum [cm] | Minimum [cm] |
|---|---|---|---|
| 15.09.2019 | 102 | 102 | 102 |
| 14.09.2019 | 102 | 103 | 102 |
| 13.09.2019 | 103 | 103 | 102 |
| 12.09.2019 | 103 | 103 | 103 |
| 11.09.2019 | 103 | 104 | 103 |
| 10.09.2019 | 104 | 106 | 104 |
| 09.09.2019 | 106 | 108 | 105 |
© Bayerisches Landesamt für Umwelt 2024