
- Startseite >
- Flüsse >
- Wasserstand >
- Obere Donau >
- Vohburg >
- Jahresgrafik

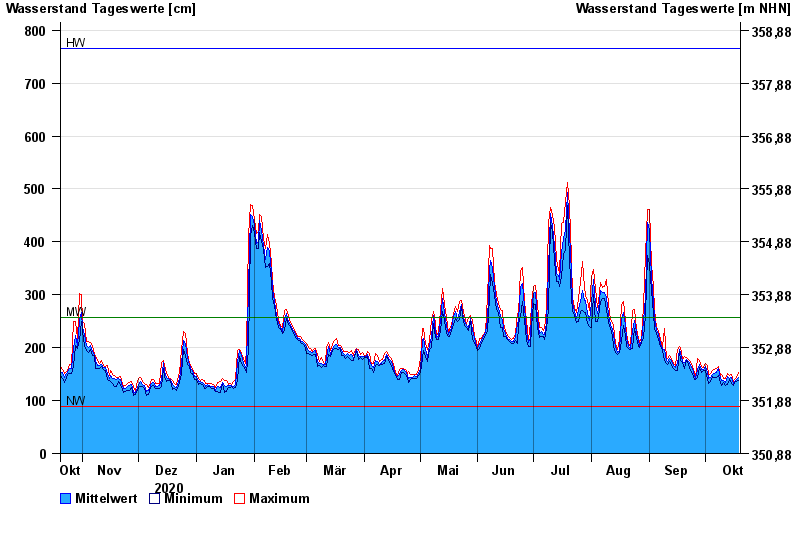
Jahresgrafik Vohburg / Donau
Wasserstand vom 20.10.2020 bis zum 19.10.2021
| Datum | Mittelwert [cm] | Maximum [cm] | Minimum [cm] |
|---|---|---|---|
| 19.10.2021 | 144 | 154 | 138 |
| 18.10.2021 | 140 | 144 | 137 |
| 17.10.2021 | 137 | 140 | 134 |
| 16.10.2021 | 133 | 137 | 129 |
| 15.10.2021 | 143 | 149 | 132 |
| 14.10.2021 | 142 | 147 | 139 |
| 13.10.2021 | 145 | 152 | 130 |
© Bayerisches Landesamt für Umwelt 2024