
- Startseite >
- Flüsse >
- Wasserstand >
- Obere Donau >
- Unterbergen >
- Jahresgrafik

Jahresgrafik Unterbergen / Lochbach
Wasserstand vom 20.08.2019 bis zum 19.08.2020
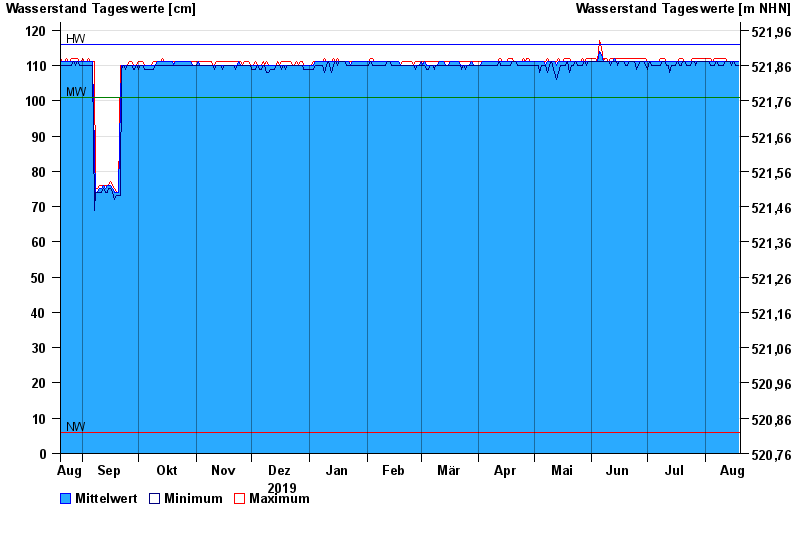
| Datum | Mittelwert [cm] | Maximum [cm] | Minimum [cm] |
|---|---|---|---|
| 19.08.2020 | 111 | 111 | 110 |
| 18.08.2020 | 111 | 111 | 110 |
| 17.08.2020 | 111 | 111 | 110 |
| 16.08.2020 | 111 | 111 | 111 |
| 15.08.2020 | 111 | 111 | 110 |
| 14.08.2020 | 111 | 111 | 111 |
| 13.08.2020 | 111 | 111 | 111 |
© Bayerisches Landesamt für Umwelt 2024