
- Startseite >
- Flüsse >
- Wasserstand >
- Obere Donau >
- Unterbergen >
- Jahresgrafik

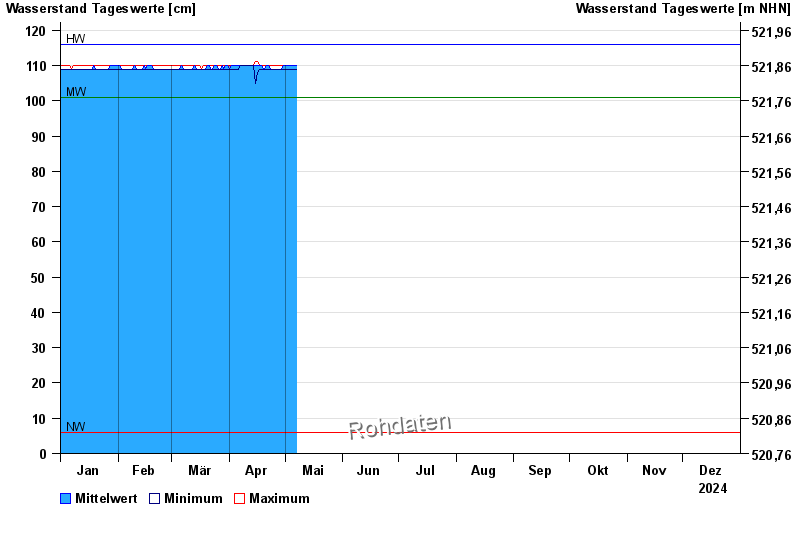
Jahresgrafik Unterbergen / Lochbach
Wasserstand vom 01.01.2024 bis zum 31.12.2024
| Datum | Mittelwert [cm] | Maximum [cm] | Minimum [cm] |
|---|---|---|---|
| 09.06.2024 | 110 | 110 | 109 |
| 08.06.2024 | 110 | 110 | 109 |
| 07.06.2024 | 110 | 110 | 109 |
| 06.06.2024 | 110 | 110 | 109 |
| 05.06.2024 | 96 | 111 | 71 |
| 04.06.2024 | 71 | 72 | 71 |
| 03.06.2024 | 71 | 72 | 71 |
© Bayerisches Landesamt für Umwelt 2024