
- Startseite >
- Flüsse >
- Wasserstand >
- Obere Donau >
- Treuchtlingen >
- Jahresgrafik

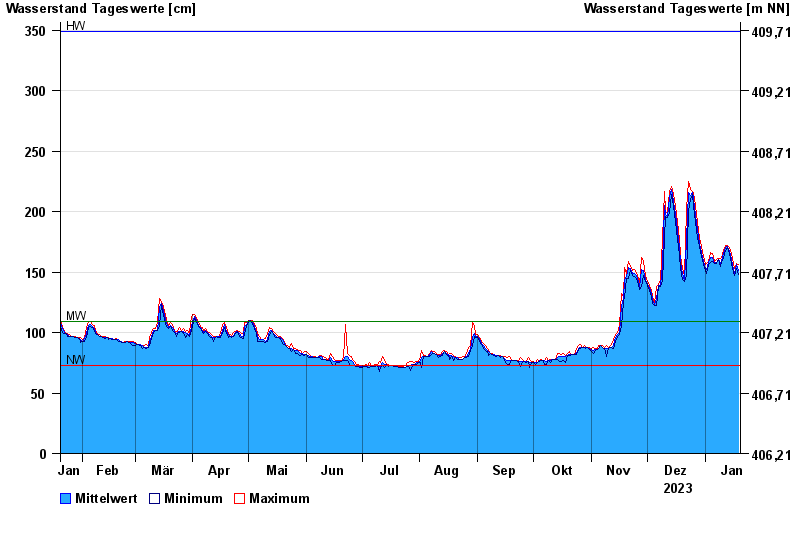
Jahresgrafik Treuchtlingen / Altmühl
Wasserstand vom 20.01.2023 bis zum 19.01.2024
| Datum | Mittelwert [cm] | Maximum [cm] | Minimum [cm] |
|---|---|---|---|
| 19.01.2024 | 151 | 156 | 148 |
| 18.01.2024 | 156 | 157 | 153 |
| 17.01.2024 | 149 | 153 | 147 |
| 16.01.2024 | 152 | 157 | 150 |
| 15.01.2024 | 160 | 165 | 157 |
| 14.01.2024 | 167 | 170 | 165 |
| 13.01.2024 | 171 | 172 | 170 |
© Bayerisches Landesamt für Umwelt 2024