
- Startseite >
- Flüsse >
- Wasserstand >
- Obere Donau >
- Treuchtlingen >
- Jahresgrafik

Jahresgrafik Treuchtlingen / Altmühl
Wasserstand vom 01.01.2023 bis zum 31.12.2023
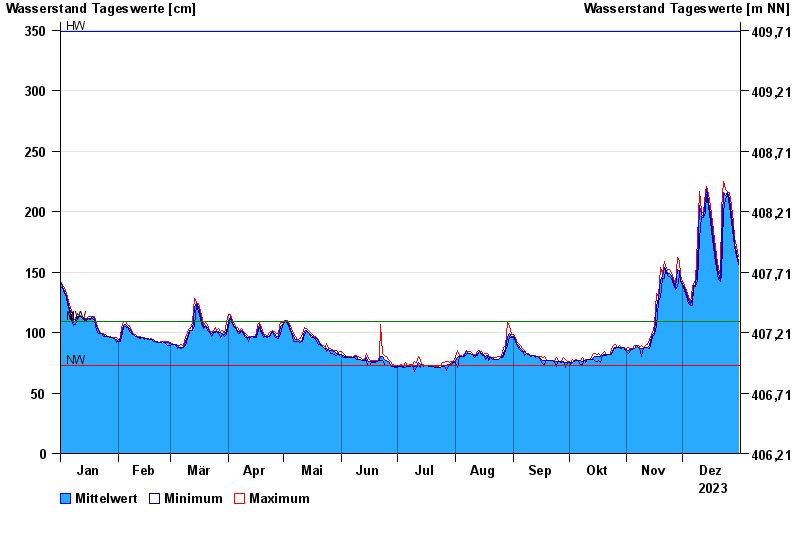
| Datum | Mittelwert [cm] | Maximum [cm] | Minimum [cm] |
|---|---|---|---|
| 31.12.2023 | 159 | 163 | 156 |
| 30.12.2023 | 166 | 171 | 163 |
| 29.12.2023 | 174 | 179 | 171 |
| 28.12.2023 | 185 | 191 | 179 |
| 27.12.2023 | 197 | 205 | 191 |
| 26.12.2023 | 211 | 216 | 205 |
| 25.12.2023 | 216 | 217 | 214 |
 weitere Messwerte weitere Messwerte | |||

© Bayerisches Landesamt für Umwelt 2024