
- Startseite >
- Flüsse >
- Wasserstand >
- Obere Donau >
- Treuchtlingen >
- Jahresgrafik

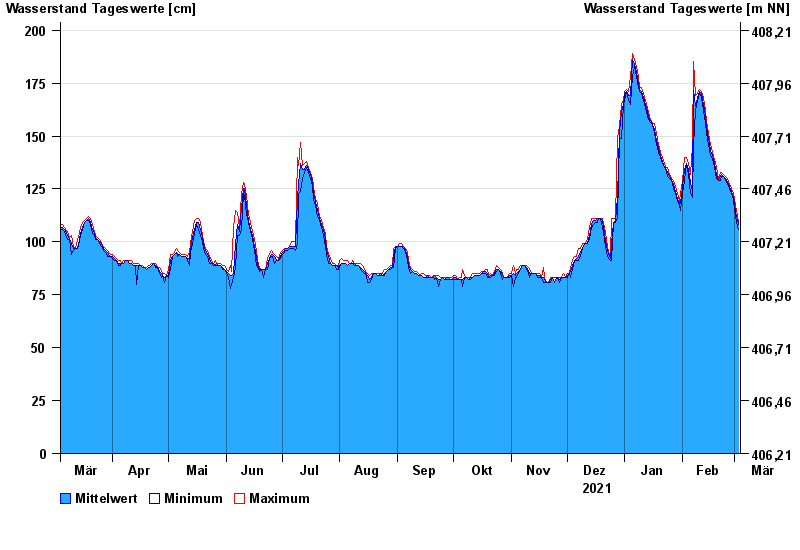
Jahresgrafik Treuchtlingen / Altmühl
Wasserstand vom 04.03.2021 bis zum 03.03.2022
- 18.03.1988 Wasserstand: 349 cm
- 15.04.1994 Wasserstand: 338 cm
- 22.12.1993 Wasserstand: 336 cm
- 04.03.1987 Wasserstand: 325 cm
- 27.03.1988 Wasserstand: 315 cm
| Datum | Mittelwert [cm] | Maximum [cm] | Minimum [cm] |
|---|---|---|---|
| 03.03.2022 | 108 | 109 | 106 |
| 02.03.2022 | 112 | 115 | 109 |
| 01.03.2022 | 117 | 120 | 115 |
| 28.02.2022 | 121 | 123 | 120 |
| 27.02.2022 | 124 | 125 | 123 |
| 26.02.2022 | 126 | 127 | 125 |
| 25.02.2022 | 128 | 130 | 127 |
© Bayerisches Landesamt für Umwelt 2024