
- Startseite >
- Flüsse >
- Wasserstand >
- Obere Donau >
- Treuchtlingen >
- Jahresgrafik

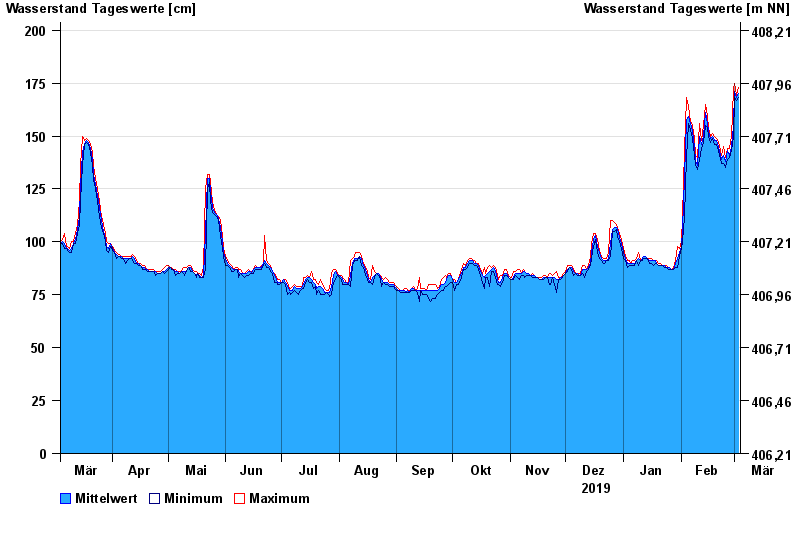
Jahresgrafik Treuchtlingen / Altmühl
Wasserstand vom 04.03.2019 bis zum 03.03.2020
- 18.03.1988 Wasserstand: 349 cm
- 15.04.1994 Wasserstand: 338 cm
- 22.12.1993 Wasserstand: 336 cm
- 04.03.1987 Wasserstand: 325 cm
- 27.03.1988 Wasserstand: 315 cm
| Datum | Mittelwert [cm] | Maximum [cm] | Minimum [cm] |
|---|---|---|---|
| 03.03.2020 | 170 | 173 | 168 |
| 02.03.2020 | 168 | 169 | 167 |
| 01.03.2020 | 171 | 175 | 168 |
| 29.02.2020 | 155 | 172 | 150 |
| 28.02.2020 | 145 | 150 | 143 |
| 27.02.2020 | 141 | 144 | 140 |
| 26.02.2020 | 143 | 144 | 139 |
© Bayerisches Landesamt für Umwelt 2024