
- Startseite >
- Flüsse >
- Wasserstand >
- Obere Donau >
- Thann >
- Jahresgrafik

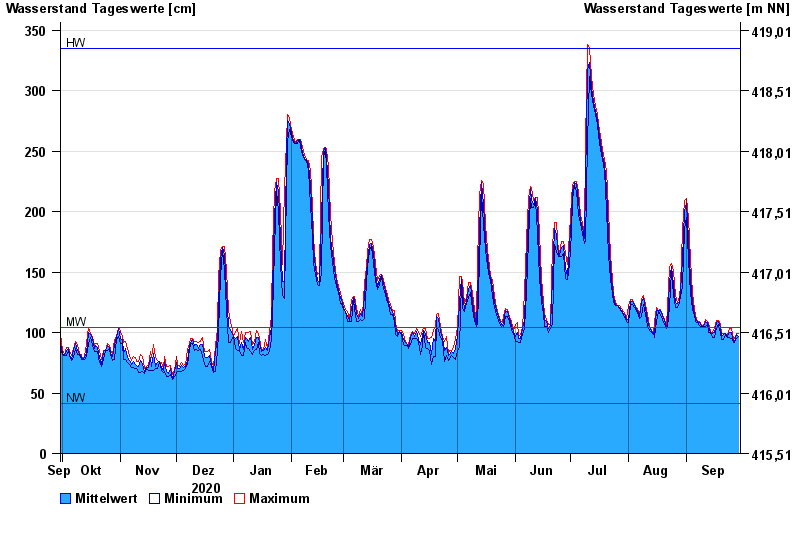
Jahresgrafik Thann / Altmühl
Wasserstand vom 30.09.2020 bis zum 29.09.2021
| Datum | Mittelwert [cm] | Maximum [cm] | Minimum [cm] |
|---|---|---|---|
| 29.09.2021 | 97 | 99 | 97 |
| 28.09.2021 | 98 | 99 | 95 |
| 27.09.2021 | 92 | 95 | 92 |
| 26.09.2021 | 93 | 95 | 92 |
| 25.09.2021 | 100 | 103 | 95 |
| 24.09.2021 | 100 | 103 | 96 |
| 23.09.2021 | 97 | 98 | 96 |
© Bayerisches Landesamt für Umwelt 2024