
- Startseite >
- Flüsse >
- Wasserstand >
- Obere Donau >
- Seemannsmühle >
- Jahresgrafik

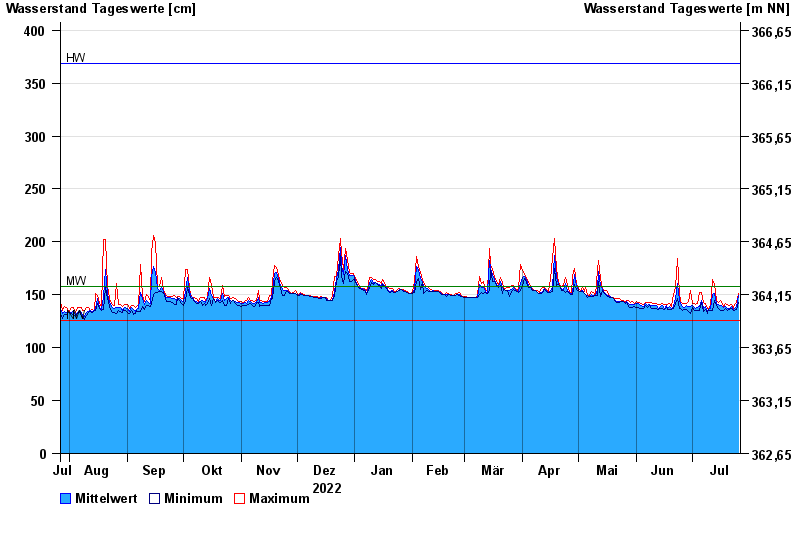
Jahresgrafik Seemannsmühle / Schwäbische Rezat
Wasserstand vom 27.07.2022 bis zum 26.07.2023
| Datum | Mittelwert [cm] | Maximum [cm] | Minimum [cm] |
|---|---|---|---|
| 26.07.2023 | 149 | 151 | 143 |
| 25.07.2023 | 139 | 143 | 136 |
| 24.07.2023 | 137 | 141 | 135 |
| 23.07.2023 | 135 | 137 | 135 |
| 22.07.2023 | 139 | 141 | 137 |
| 21.07.2023 | 137 | 140 | 136 |
| 20.07.2023 | 137 | 141 | 135 |
© Bayerisches Landesamt für Umwelt 2024