
- Startseite >
- Flüsse >
- Wasserstand >
- Obere Donau >
- Seemannsmühle >
- Jahresgrafik

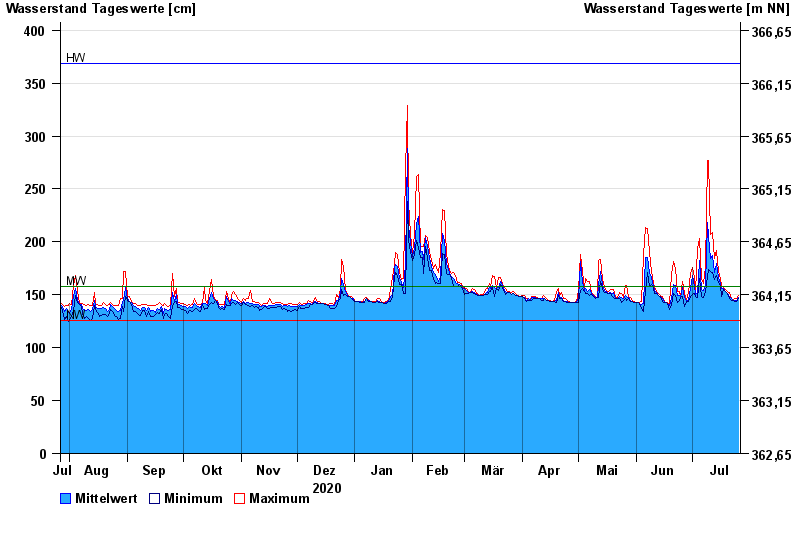
Jahresgrafik Seemannsmühle / Schwäbische Rezat
Wasserstand vom 27.07.2020 bis zum 26.07.2021
| Datum | Mittelwert [cm] | Maximum [cm] | Minimum [cm] |
|---|---|---|---|
| 26.07.2021 | 147 | 149 | 146 |
| 25.07.2021 | 145 | 146 | 144 |
| 24.07.2021 | 145 | 146 | 144 |
| 23.07.2021 | 145 | 145 | 145 |
| 22.07.2021 | 146 | 146 | 145 |
| 21.07.2021 | 148 | 152 | 146 |
| 20.07.2021 | 151 | 153 | 151 |
© Bayerisches Landesamt für Umwelt 2024