
- Startseite >
- Flüsse >
- Wasserstand >
- Obere Donau >
- Seemannsmühle >
- Jahresgrafik

Jahresgrafik Seemannsmühle / Schwäbische Rezat
Wasserstand vom 27.02.2021 bis zum 26.02.2022
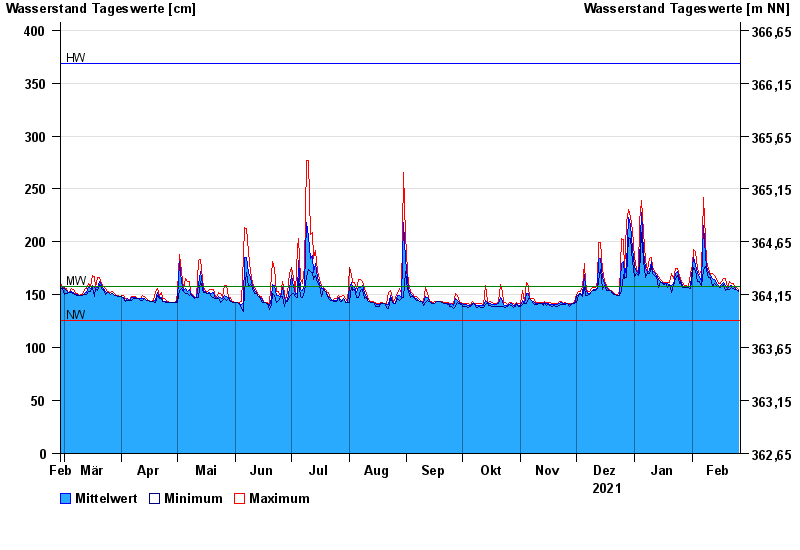
| Datum | Mittelwert [cm] | Maximum [cm] | Minimum [cm] |
|---|---|---|---|
| 26.02.2022 | 154 | 155 | 153 |
| 25.02.2022 | 155 | 157 | 155 |
| 24.02.2022 | 157 | 158 | 155 |
| 23.02.2022 | 158 | 161 | 156 |
| 22.02.2022 | 159 | 161 | 157 |
| 21.02.2022 | 158 | 163 | 155 |
| 20.02.2022 | 156 | 157 | 155 |
© Bayerisches Landesamt für Umwelt 2024