
- Startseite >
- Flüsse >
- Wasserstand >
- Obere Donau >
- Schmidmühlen >
- Jahresgrafik

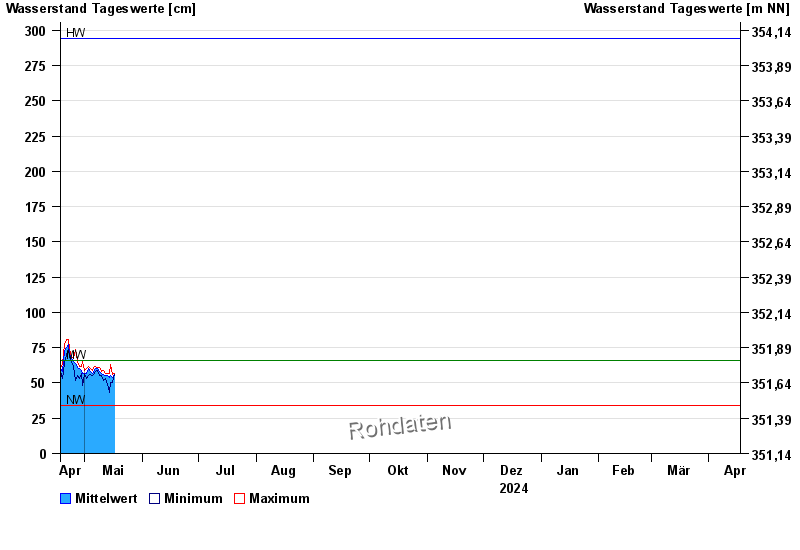
Jahresgrafik Schmidmühlen / Vils
Wasserstand vom 18.04.2024 bis zum 17.04.2025
| Datum | Mittelwert [cm] | Maximum [cm] | Minimum [cm] |
|---|---|---|---|
| 15.06.2024 | 66 | 67 | 65 |
| 14.06.2024 | 66 | 68 | 64 |
| 13.06.2024 | 68 | 71 | 66 |
| 12.06.2024 | 68 | 72 | 66 |
| 11.06.2024 | 70 | 74 | 68 |
| 10.06.2024 | 74 | 76 | 72 |
| 09.06.2024 | 80 | 84 | 76 |
© Bayerisches Landesamt für Umwelt 2024