
- Startseite >
- Flüsse >
- Wasserstand >
- Obere Donau >
- Roth Bleiche >
- Jahresgrafik

Jahresgrafik Roth Bleiche / Roth
Wasserstand vom 14.08.2021 bis zum 13.08.2022
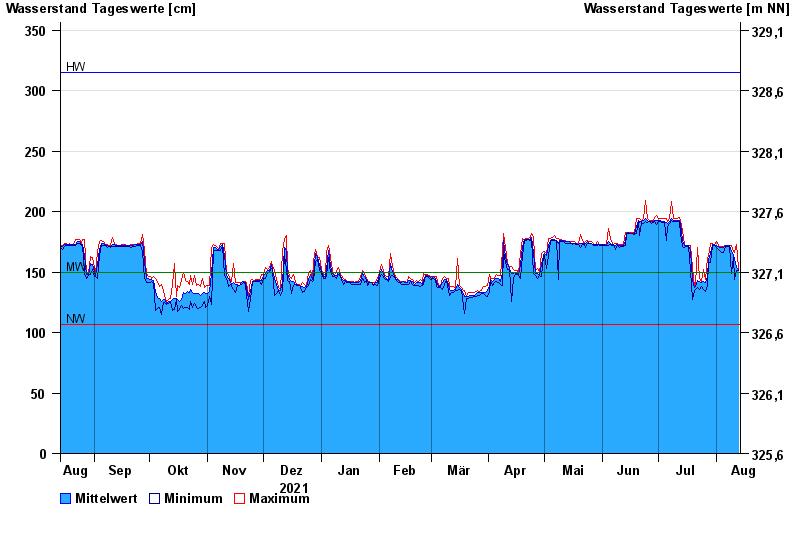
| Datum | Mittelwert [cm] | Maximum [cm] | Minimum [cm] |
|---|---|---|---|
| 13.08.2022 | 152 | 153 | 151 |
| 12.08.2022 | 154 | 173 | 151 |
| 11.08.2022 | 160 | 166 | 144 |
| 10.08.2022 | 164 | 167 | 162 |
| 09.08.2022 | 167 | 172 | 149 |
| 08.08.2022 | 172 | 172 | 171 |
| 07.08.2022 | 172 | 172 | 171 |
© Bayerisches Landesamt für Umwelt 2024