
- Startseite >
- Flüsse >
- Wasserstand >
- Obere Donau >
- Roth Bleiche >
- Jahresgrafik

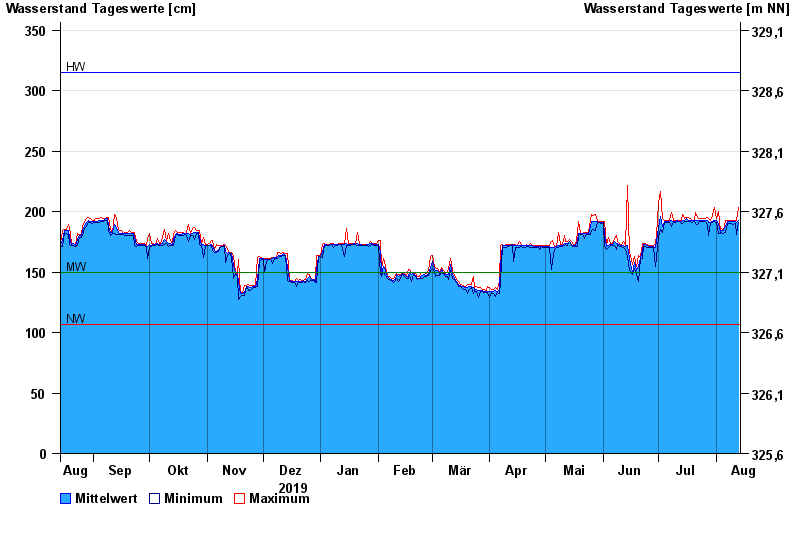
Jahresgrafik Roth Bleiche / Roth
Wasserstand vom 14.08.2019 bis zum 13.08.2020
| Datum | Mittelwert [cm] | Maximum [cm] | Minimum [cm] |
|---|---|---|---|
| 13.08.2020 | 193 | 203 | 191 |
| 12.08.2020 | 191 | 193 | 181 |
| 11.08.2020 | 192 | 193 | 190 |
| 10.08.2020 | 192 | 193 | 189 |
| 09.08.2020 | 192 | 193 | 190 |
| 08.08.2020 | 192 | 193 | 190 |
| 07.08.2020 | 192 | 193 | 190 |
© Bayerisches Landesamt für Umwelt 2024