
- Startseite >
- Flüsse >
- Wasserstand >
- Obere Donau >
- Regensburg Eiserne Brücke >
- Jahresgrafik

Jahresgrafik Regensburg Eiserne Brücke / Donau
Wasserstand vom 27.02.2021 bis zum 26.02.2022
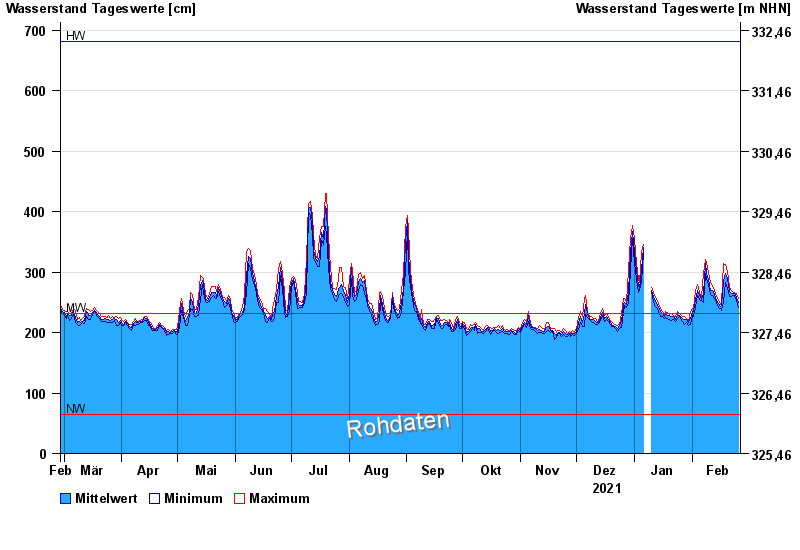
| Datum | Mittelwert [cm] | Maximum [cm] | Minimum [cm] |
|---|---|---|---|
| 26.02.2022 | 249 | 256 | 242 |
| 25.02.2022 | 258 | 265 | 253 |
| 24.02.2022 | 265 | 267 | 262 |
| 23.02.2022 | 264 | 266 | 262 |
| 22.02.2022 | 265 | 269 | 260 |
| 21.02.2022 | 268 | 274 | 260 |
| 20.02.2022 | 289 | 301 | 273 |
© Bayerisches Landesamt für Umwelt 2024