
- Startseite >
- Flüsse >
- Wasserstand >
- Obere Donau >
- Regensburg Eiserne Brücke >
- Jahresgrafik

Jahresgrafik Regensburg Eiserne Brücke / Donau
Wasserstand vom 20.10.2022 bis zum 19.10.2023
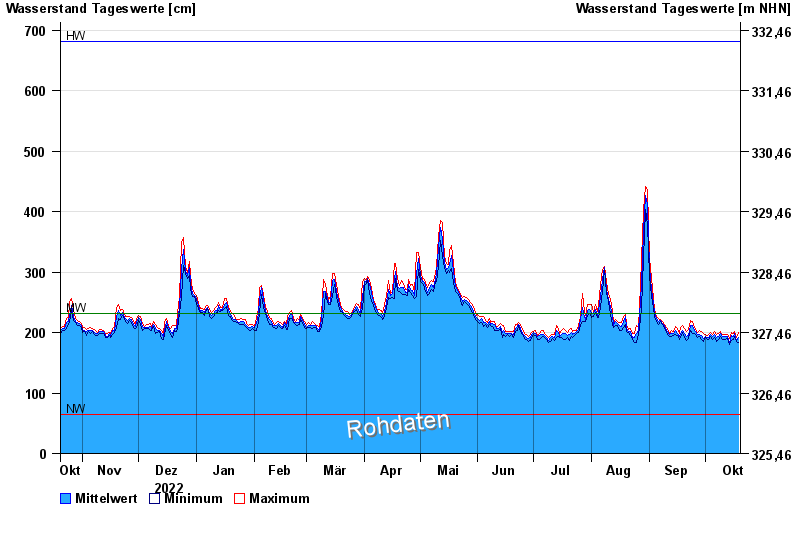
| Datum | Mittelwert [cm] | Maximum [cm] | Minimum [cm] |
|---|---|---|---|
| 19.10.2023 | 192 | 200 | 184 |
| 18.10.2023 | 187 | 192 | 185 |
| 17.10.2023 | 198 | 201 | 193 |
| 16.10.2023 | 194 | 199 | 189 |
| 15.10.2023 | 195 | 200 | 187 |
| 14.10.2023 | 184 | 190 | 181 |
| 13.10.2023 | 194 | 196 | 190 |
© Bayerisches Landesamt für Umwelt 2024