
- Startseite >
- Flüsse >
- Wasserstand >
- Obere Donau >
- Regensburg Eiserne Brücke >
- Jahresgrafik

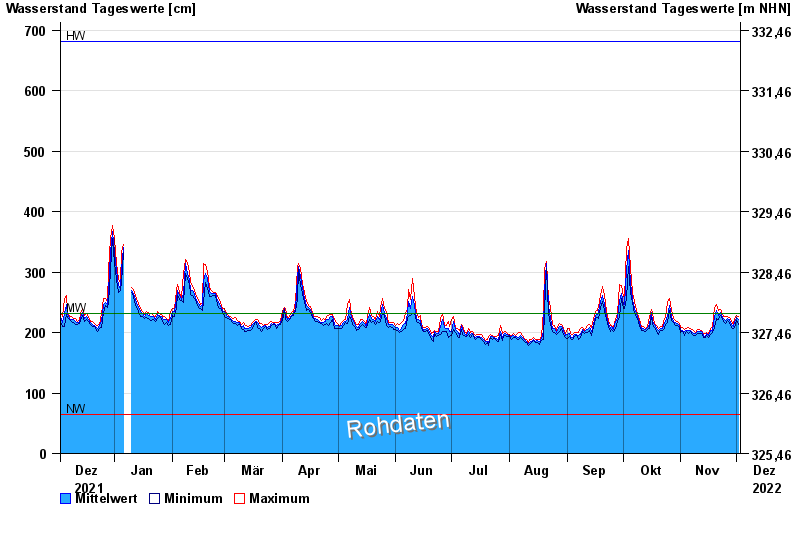
Jahresgrafik Regensburg Eiserne Brücke / Donau
Wasserstand vom 03.12.2021 bis zum 02.12.2022
| Datum | Mittelwert [cm] | Maximum [cm] | Minimum [cm] |
|---|---|---|---|
| 02.12.2022 | 221 | 227 | 214 |
| 01.12.2022 | 225 | 229 | 220 |
| 30.11.2022 | 217 | 223 | 209 |
| 29.11.2022 | 210 | 214 | 206 |
| 28.11.2022 | 214 | 218 | 208 |
| 27.11.2022 | 221 | 225 | 216 |
| 26.11.2022 | 224 | 227 | 220 |
© Bayerisches Landesamt für Umwelt 2024