
- Startseite >
- Flüsse >
- Wasserstand >
- Obere Donau >
- Pfaffenhofen >
- Jahresgrafik

Jahresgrafik Pfaffenhofen / Zusam
Wasserstand vom 05.10.2022 bis zum 04.10.2023
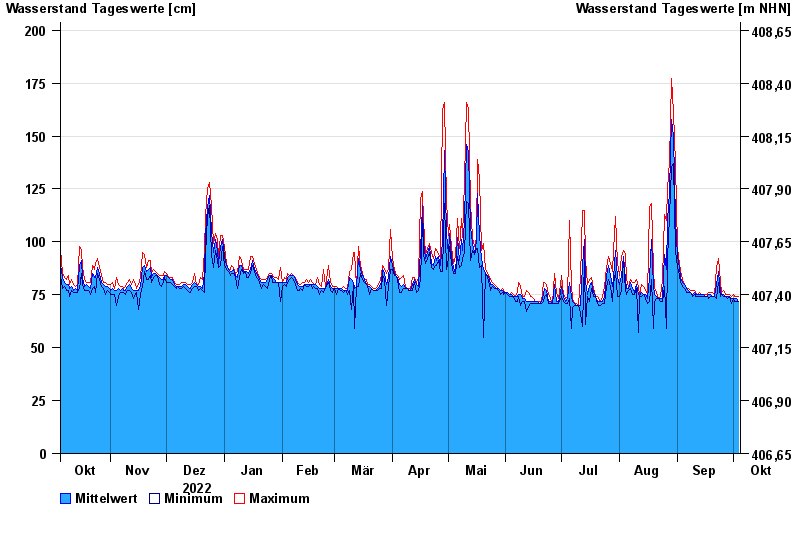
- Hochwassergefahrenfläche HQ100 360 cm
| Datum | Mittelwert [cm] | Maximum [cm] | Minimum [cm] |
|---|---|---|---|
| 04.10.2023 | 72 | 74 | 72 |
| 03.10.2023 | 73 | 74 | 72 |
| 02.10.2023 | 73 | 74 | 72 |
| 01.10.2023 | 73 | 75 | 73 |
| 30.09.2023 | 73 | 74 | 71 |
| 29.09.2023 | 74 | 75 | 74 |
| 28.09.2023 | 74 | 75 | 73 |
© Bayerisches Landesamt für Umwelt 2024