
- Startseite >
- Flüsse >
- Wasserstand >
- Obere Donau >
- Parsberg >
- Jahresgrafik

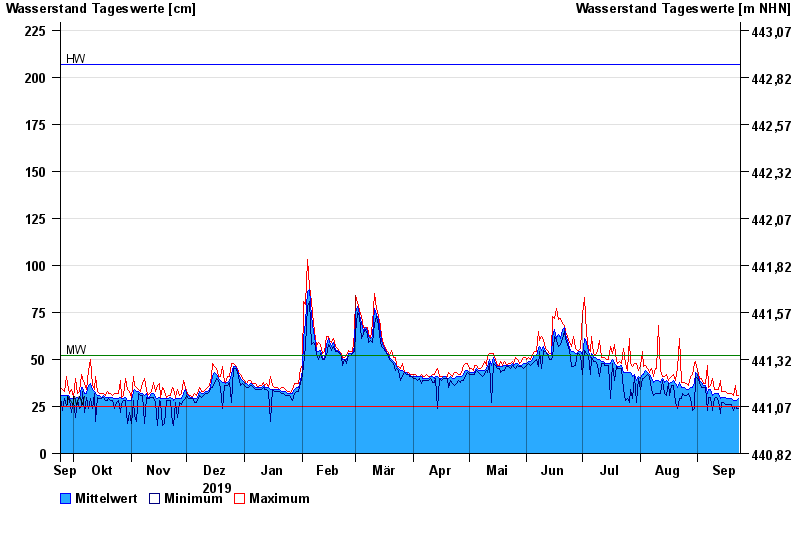
Jahresgrafik Parsberg / Schwarze Laber
Wasserstand vom 24.09.2019 bis zum 23.09.2020
| Datum | Mittelwert [cm] | Maximum [cm] | Minimum [cm] |
|---|---|---|---|
| 23.09.2020 | 29 | 31 | 24 |
| 22.09.2020 | 28 | 31 | 24 |
| 21.09.2020 | 28 | 36 | 25 |
| 20.09.2020 | 28 | 31 | 23 |
| 19.09.2020 | 29 | 32 | 26 |
| 18.09.2020 | 29 | 32 | 26 |
| 17.09.2020 | 29 | 32 | 26 |
© Bayerisches Landesamt für Umwelt 2024