
- Startseite >
- Flüsse >
- Wasserstand >
- Obere Donau >
- Parsberg >
- Jahresgrafik

Jahresgrafik Parsberg / Schwarze Laber
Wasserstand vom 20.04.2024 bis zum 19.04.2025
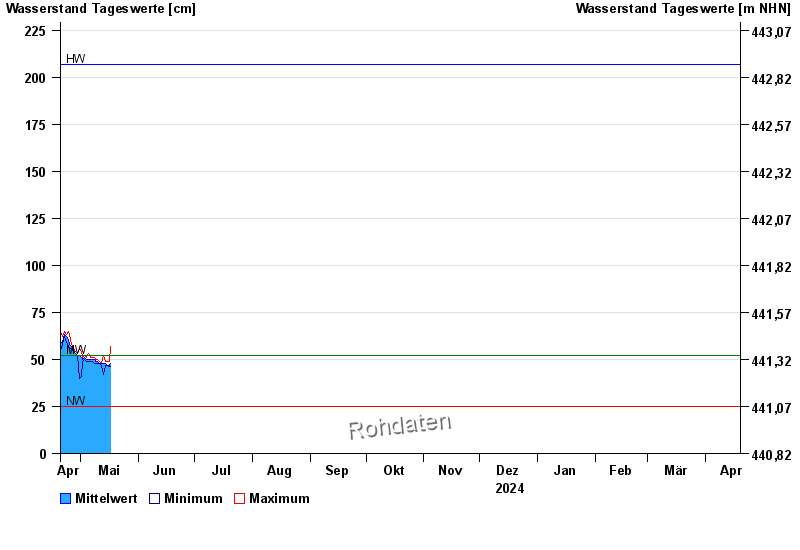
| Datum | Mittelwert [cm] | Maximum [cm] | Minimum [cm] |
|---|---|---|---|
| 02.05.2024 | 51 | 51 | 50 |
| 01.05.2024 | 51 | 54 | 41 |
| 30.04.2024 | 52 | 56 | 40 |
| 29.04.2024 | 52 | 53 | 52 |
| 28.04.2024 | 53 | 54 | 53 |
| 27.04.2024 | 55 | 56 | 54 |
| 26.04.2024 | 57 | 58 | 56 |
© Bayerisches Landesamt für Umwelt 2024