
- Startseite >
- Flüsse >
- Wasserstand >
- Obere Donau >
- Parsberg >
- Jahresgrafik

Jahresgrafik Parsberg / Schwarze Laber
Wasserstand vom 07.03.2021 bis zum 06.03.2022
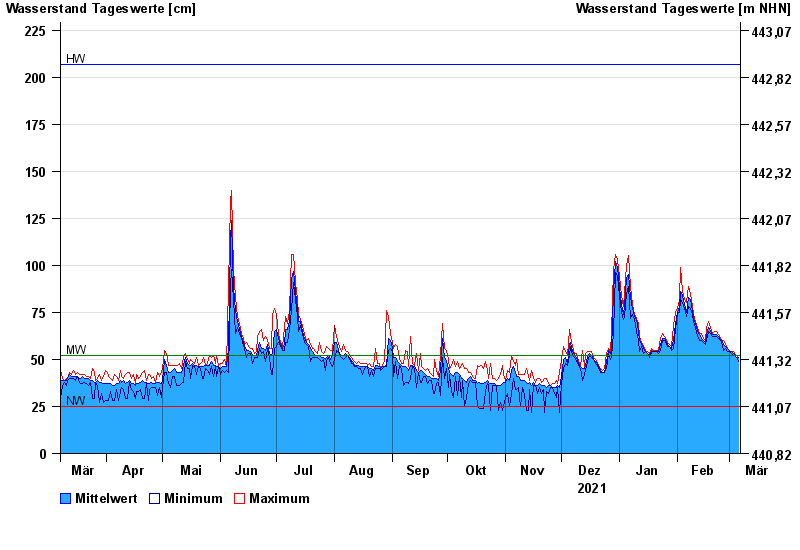
| Datum | Mittelwert [cm] | Maximum [cm] | Minimum [cm] |
|---|---|---|---|
| 06.03.2022 | 51 | 51 | 49 |
| 05.03.2022 | 51 | 52 | 51 |
| 04.03.2022 | 52 | 53 | 52 |
| 03.03.2022 | 53 | 54 | 52 |
| 02.03.2022 | 54 | 54 | 53 |
| 01.03.2022 | 55 | 55 | 54 |
| 28.02.2022 | 56 | 56 | 54 |
© Bayerisches Landesamt für Umwelt 2024