
- Startseite >
- Flüsse >
- Wasserstand >
- Obere Donau >
- Parsberg >
- Jahresgrafik

Jahresgrafik Parsberg / Schwarze Laber
Wasserstand vom 01.01.2024 bis zum 26.04.2024
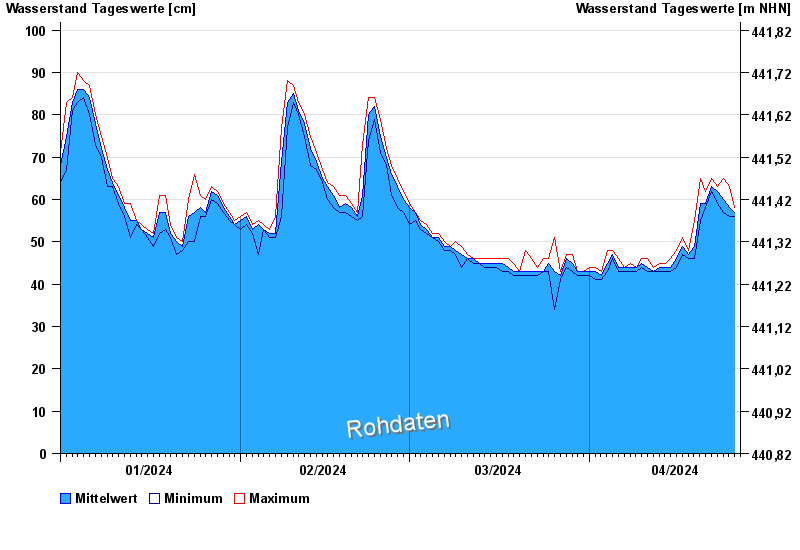
| Datum | Mittelwert [cm] | Maximum [cm] | Minimum [cm] |
|---|---|---|---|
| 26.04.2024 | 57 | 58 | 57 |
| 25.04.2024 | 58 | 63 | 56 |
| 24.04.2024 | 60 | 65 | 57 |
| 23.04.2024 | 62 | 63 | 59 |
| 22.04.2024 | 63 | 65 | 62 |
| 21.04.2024 | 59 | 62 | 58 |
| 20.04.2024 | 59 | 65 | 55 |
© Bayerisches Landesamt für Umwelt 2024