
- Startseite >
- Flüsse >
- Wasserstand >
- Obere Donau >
- Oberndorf >
- Jahresgrafik

Jahresgrafik Oberndorf / Donau
Wasserstand vom 26.10.2021 bis zum 25.10.2022
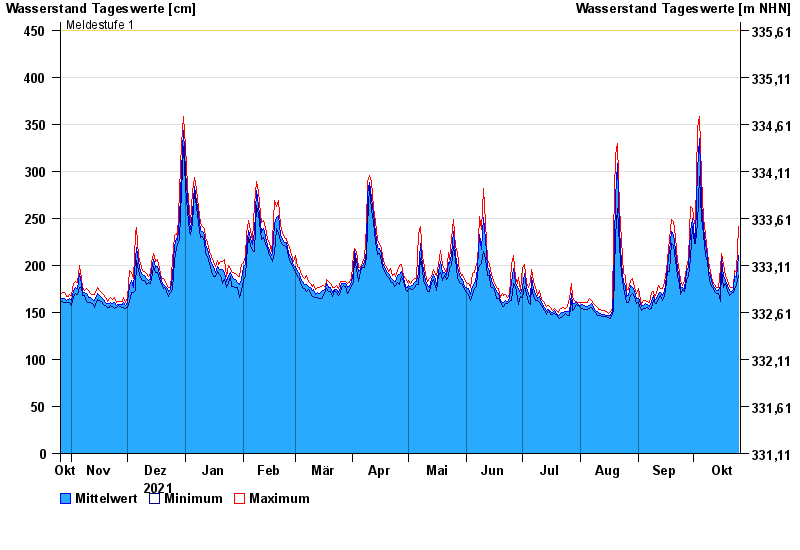
- Meldestufe 1 450 cm
- Meldestufe 2 480 cm
- Meldestufe 3 550 cm
- Meldestufe 4 610 cm
- Hochwassergefahrenfläche HQ100 770 cm
- Hochwassergefahrenfläche HQhäufig 640 cm
| Datum | Mittelwert [cm] | Maximum [cm] | Minimum [cm] |
|---|---|---|---|
| 25.10.2022 | 210 | 241 | 189 |
| 24.10.2022 | 187 | 194 | 180 |
| 23.10.2022 | 189 | 195 | 174 |
| 22.10.2022 | 174 | 177 | 171 |
| 21.10.2022 | 172 | 177 | 170 |
| 20.10.2022 | 173 | 178 | 168 |
| 19.10.2022 | 179 | 184 | 173 |
© Bayerisches Landesamt für Umwelt 2024