
- Startseite >
- Flüsse >
- Wasserstand >
- Obere Donau >
- Neumühle >
- Jahresgrafik

Jahresgrafik Neumühle / Rednitz
Wasserstand vom 28.01.2022 bis zum 27.01.2023
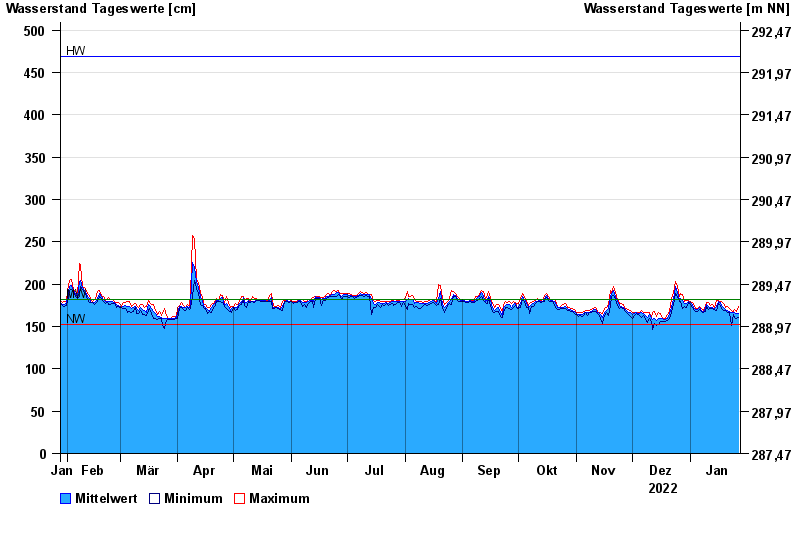
| Datum | Mittelwert [cm] | Maximum [cm] | Minimum [cm] |
|---|---|---|---|
| 27.01.2023 | 165 | 174 | 161 |
| 26.01.2023 | 165 | 168 | 159 |
| 25.01.2023 | 166 | 170 | 161 |
| 24.01.2023 | 166 | 168 | 164 |
| 23.01.2023 | 166 | 169 | 151 |
| 22.01.2023 | 168 | 171 | 166 |
| 21.01.2023 | 169 | 174 | 167 |
© Bayerisches Landesamt für Umwelt 2024