
- Startseite >
- Flüsse >
- Wasserstand >
- Obere Donau >
- Nattenhausen >
- Jahresgrafik

Jahresgrafik Nattenhausen / Günz
Wasserstand vom 22.04.2022 bis zum 21.04.2023
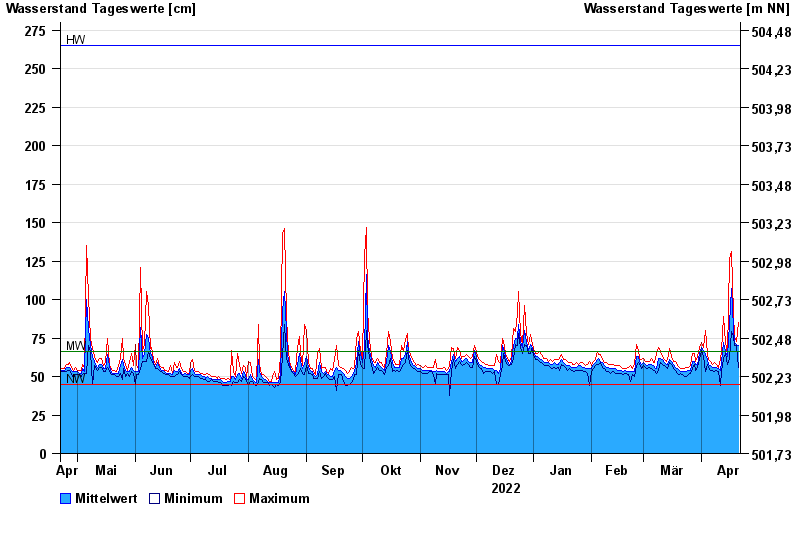
| Datum | Mittelwert [cm] | Maximum [cm] | Minimum [cm] |
|---|---|---|---|
| 21.04.2023 | 70 | 85 | 56 |
| 20.04.2023 | 71 | 73 | 70 |
| 19.04.2023 | 72 | 76 | 70 |
| 18.04.2023 | 81 | 91 | 76 |
| 17.04.2023 | 107 | 131 | 79 |
| 16.04.2023 | 84 | 126 | 62 |
| 15.04.2023 | 63 | 65 | 58 |
© Bayerisches Landesamt für Umwelt 2024