
- Startseite >
- Flüsse >
- Wasserstand >
- Obere Donau >
- Mühlried >
- Jahresgrafik

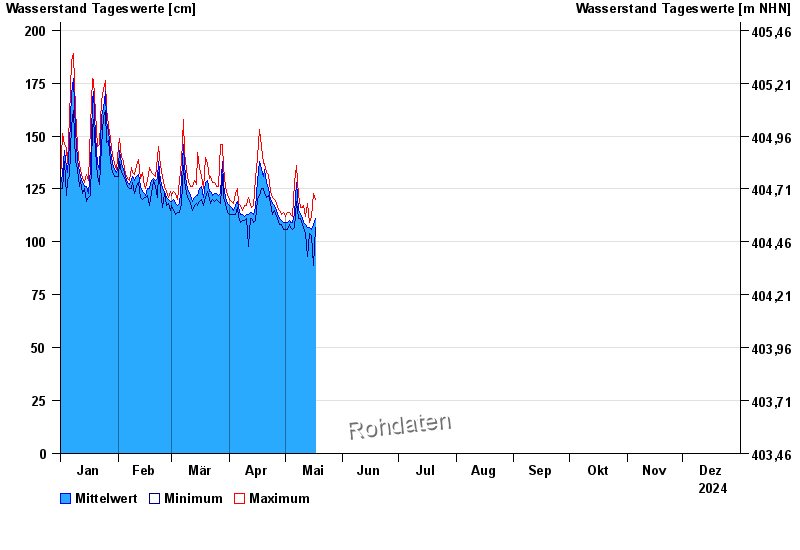
Jahresgrafik Mühlried / Paar
Wasserstand vom 01.01.2024 bis zum 31.12.2024
Hinweis
Geber 2 Defekt
| Datum | Mittelwert [cm] | Maximum [cm] | Minimum [cm] |
|---|---|---|---|
| 03.05.2024 | 110 | 111 | 108 |
| 02.05.2024 | 109 | 114 | 106 |
| 01.05.2024 | 109 | 112 | 106 |
| 30.04.2024 | 109 | 114 | 106 |
| 29.04.2024 | 110 | 113 | 108 |
| 28.04.2024 | 111 | 115 | 108 |
| 27.04.2024 | 113 | 116 | 111 |
© Bayerisches Landesamt für Umwelt 2024