
- Startseite >
- Flüsse >
- Wasserstand >
- Obere Donau >
- Mühlried >
- Jahresgrafik

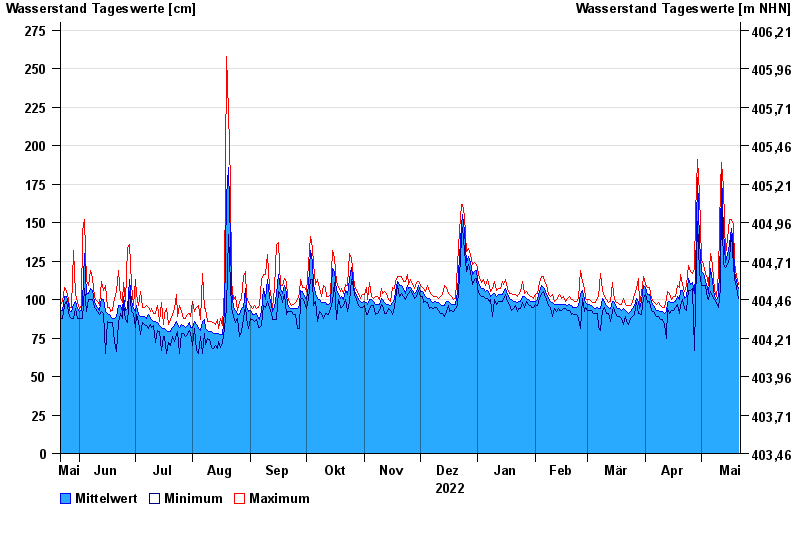
Jahresgrafik Mühlried / Paar
Wasserstand vom 22.05.2022 bis zum 21.05.2023
Hinweis
Geber 2 Defekt
| Datum | Mittelwert [cm] | Maximum [cm] | Minimum [cm] |
|---|---|---|---|
| 21.05.2023 | 107 | 110 | 101 |
| 20.05.2023 | 112 | 115 | 108 |
| 19.05.2023 | 118 | 124 | 113 |
| 18.05.2023 | 134 | 149 | 122 |
| 17.05.2023 | 146 | 152 | 142 |
| 16.05.2023 | 136 | 152 | 127 |
| 15.05.2023 | 129 | 139 | 123 |
© Bayerisches Landesamt für Umwelt 2024