
- Startseite >
- Flüsse >
- Wasserstand >
- Obere Donau >
- Langerringen >
- Jahresgrafik

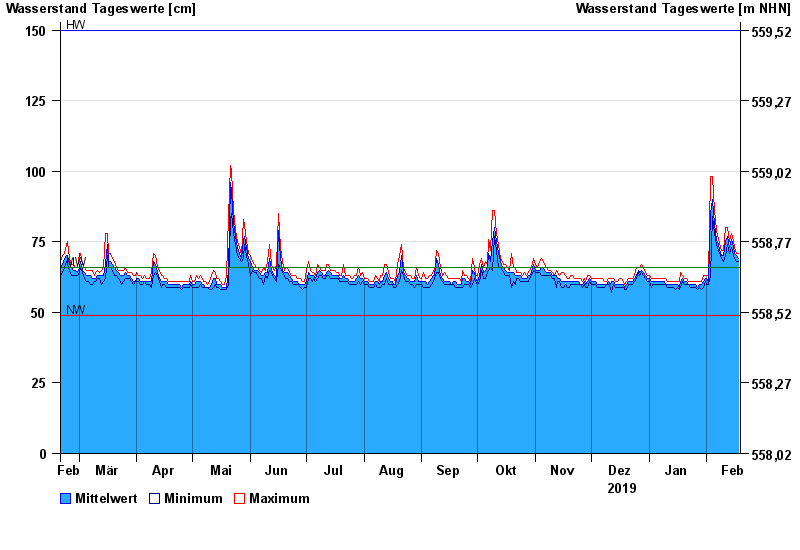
Jahresgrafik Langerringen / Singold
Wasserstand vom 19.02.2019 bis zum 18.02.2020
| Datum | Mittelwert [cm] | Maximum [cm] | Minimum [cm] |
|---|---|---|---|
| 18.02.2020 | 69 | 71 | 68 |
| 17.02.2020 | 70 | 71 | 68 |
| 16.02.2020 | 71 | 73 | 69 |
| 15.02.2020 | 73 | 75 | 70 |
| 14.02.2020 | 76 | 78 | 73 |
| 13.02.2020 | 73 | 75 | 71 |
| 12.02.2020 | 77 | 80 | 74 |
© Bayerisches Landesamt für Umwelt 2024