
- Startseite >
- Flüsse >
- Wasserstand >
- Obere Donau >
- Langerringen >
- Jahresgrafik

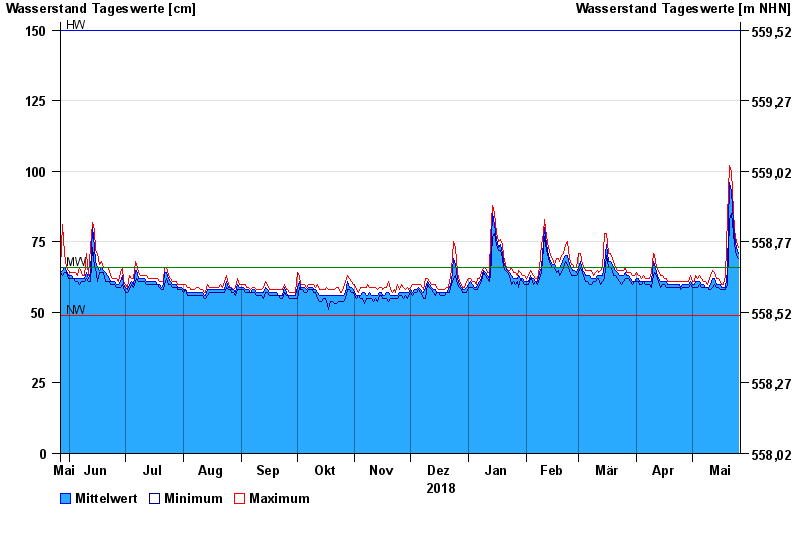
Jahresgrafik Langerringen / Singold
Wasserstand vom 27.05.2018 bis zum 26.05.2019
| Datum | Mittelwert [cm] | Maximum [cm] | Minimum [cm] |
|---|---|---|---|
| 26.05.2019 | 71 | 73 | 69 |
| 25.05.2019 | 73 | 75 | 70 |
| 24.05.2019 | 77 | 79 | 74 |
| 23.05.2019 | 82 | 86 | 78 |
| 22.05.2019 | 93 | 100 | 85 |
| 21.05.2019 | 96 | 102 | 83 |
| 20.05.2019 | 65 | 84 | 60 |
© Bayerisches Landesamt für Umwelt 2024