
- Startseite >
- Flüsse >
- Wasserstand >
- Obere Donau >
- Langengeisling >
- Jahresgrafik

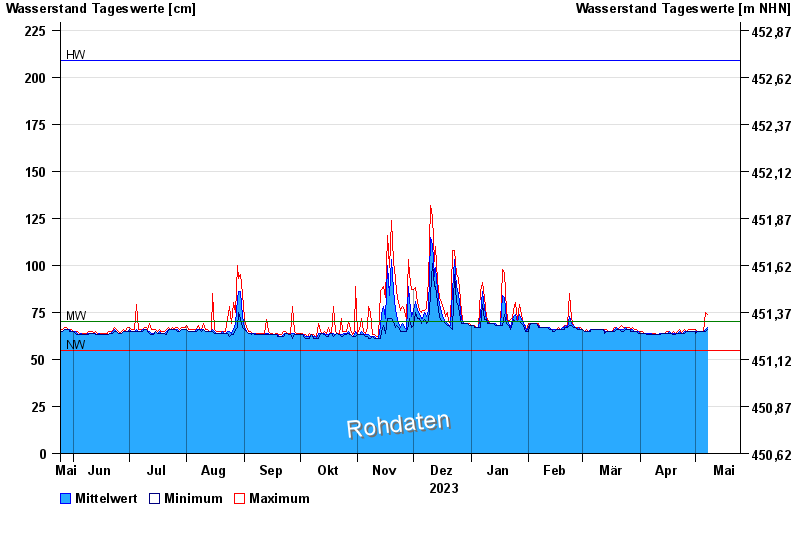
Jahresgrafik Langengeisling / Saubach
Wasserstand vom 25.05.2023 bis zum 24.05.2024
| Datum | Mittelwert [cm] | Maximum [cm] | Minimum [cm] |
|---|---|---|---|
| 26.04.2024 | 65 | 65 | 65 |
| 25.04.2024 | 65 | 66 | 64 |
| 24.04.2024 | 64 | 65 | 64 |
| 23.04.2024 | 64 | 64 | 64 |
| 22.04.2024 | 65 | 66 | 64 |
| 21.04.2024 | 64 | 65 | 64 |
| 20.04.2024 | 64 | 64 | 63 |
© Bayerisches Landesamt für Umwelt 2024