
- Startseite >
- Flüsse >
- Wasserstand >
- Obere Donau >
- Langengeisling >
- Jahresgrafik

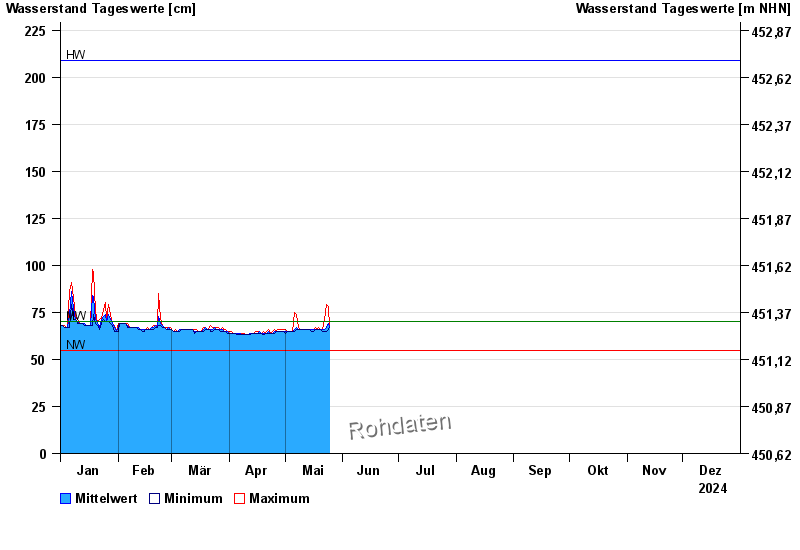
Jahresgrafik Langengeisling / Saubach
Wasserstand vom 01.01.2024 bis zum 31.12.2024
| Datum | Mittelwert [cm] | Maximum [cm] | Minimum [cm] |
|---|---|---|---|
| 13.05.2024 | 66 | 66 | 66 |
| 12.05.2024 | 66 | 66 | 66 |
| 11.05.2024 | 66 | 66 | 66 |
| 10.05.2024 | 66 | 66 | 66 |
| 09.05.2024 | 66 | 66 | 66 |
| 08.05.2024 | 66 | 67 | 66 |
| 07.05.2024 | 67 | 74 | 66 |
© Bayerisches Landesamt für Umwelt 2024