
- Startseite >
- Flüsse >
- Wasserstand >
- Obere Donau >
- Langengeisling >
- Jahresgrafik

Jahresgrafik Langengeisling / Sempt
Wasserstand vom 25.11.2021 bis zum 24.11.2022
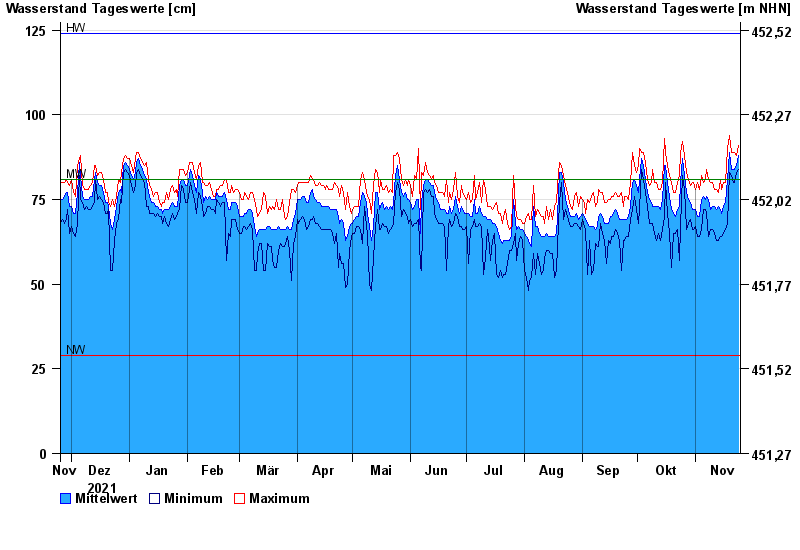
| Datum | Mittelwert [cm] | Maximum [cm] | Minimum [cm] |
|---|---|---|---|
| 24.11.2022 | 88 | 91 | 84 |
| 23.11.2022 | 85 | 88 | 83 |
| 22.11.2022 | 84 | 89 | 80 |
| 21.11.2022 | 84 | 89 | 80 |
| 20.11.2022 | 84 | 89 | 82 |
| 19.11.2022 | 89 | 94 | 83 |
| 18.11.2022 | 81 | 90 | 68 |
© Bayerisches Landesamt für Umwelt 2024