
- Startseite >
- Flüsse >
- Wasserstand >
- Obere Donau >
- Langengeisling >
- Jahresgrafik

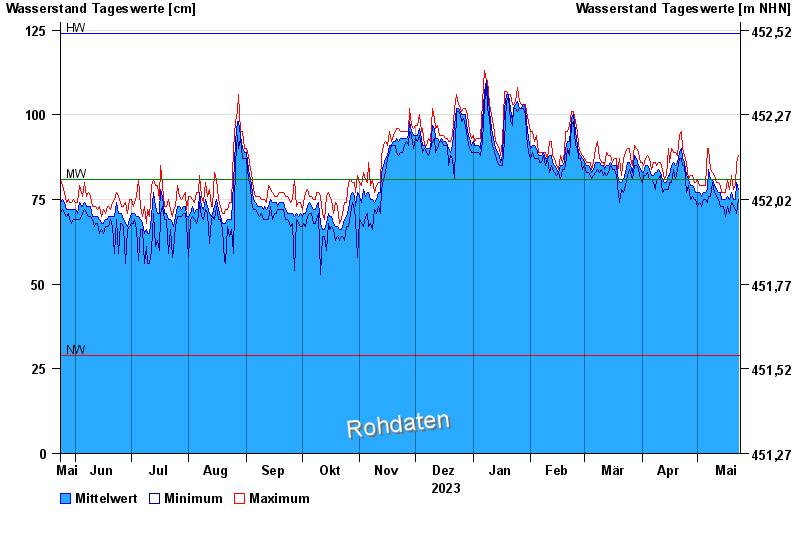
Jahresgrafik Langengeisling / Sempt
Wasserstand vom 24.05.2023 bis zum 23.05.2024
| Datum | Mittelwert [cm] | Maximum [cm] | Minimum [cm] |
|---|---|---|---|
| 09.05.2024 | 84 | 85 | 84 |
| 08.05.2024 | 83 | 86 | 76 |
| 07.05.2024 | 85 | 90 | 77 |
| 06.05.2024 | 78 | 90 | 74 |
| 05.05.2024 | 77 | 79 | 75 |
| 04.05.2024 | 77 | 79 | 75 |
| 03.05.2024 | 76 | 79 | 73 |
© Bayerisches Landesamt für Umwelt 2024