
- Startseite >
- Flüsse >
- Wasserstand >
- Obere Donau >
- Haslach NM >
- Jahresgrafik

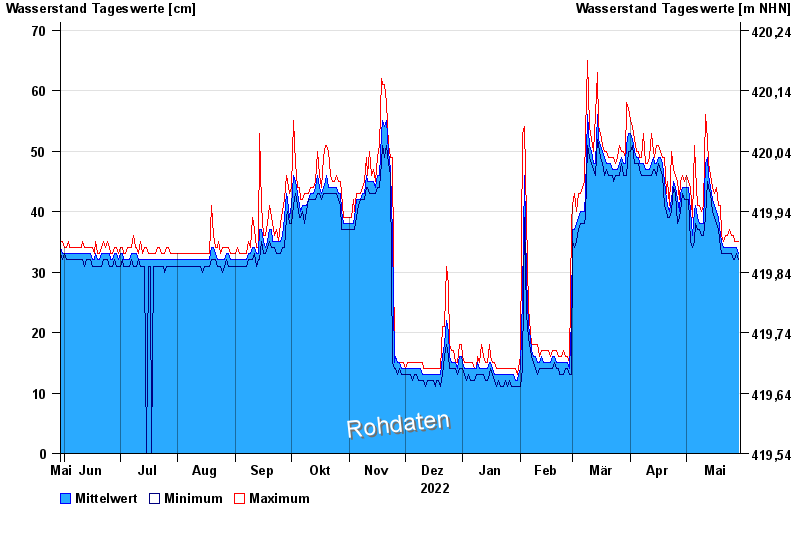
Jahresgrafik Haslach NM / Kettenbacher Leitgraben
Wasserstand vom 30.05.2022 bis zum 29.05.2023
| Datum | Mittelwert [cm] | Maximum [cm] | Minimum [cm] |
|---|---|---|---|
| 29.05.2023 | 33 | 35 | 32 |
| 28.05.2023 | 34 | 35 | 33 |
| 27.05.2023 | 34 | 35 | 32 |
| 26.05.2023 | 34 | 36 | 32 |
| 25.05.2023 | 34 | 36 | 33 |
| 24.05.2023 | 34 | 37 | 33 |
| 23.05.2023 | 34 | 36 | 33 |
© Bayerisches Landesamt für Umwelt 2024