
- Startseite >
- Flüsse >
- Wasserstand >
- Obere Donau >
- Hasberg >
- Jahresgrafik

Jahresgrafik Hasberg / Östliche Mindel
Wasserstand vom 29.03.2024 bis zum 28.03.2025
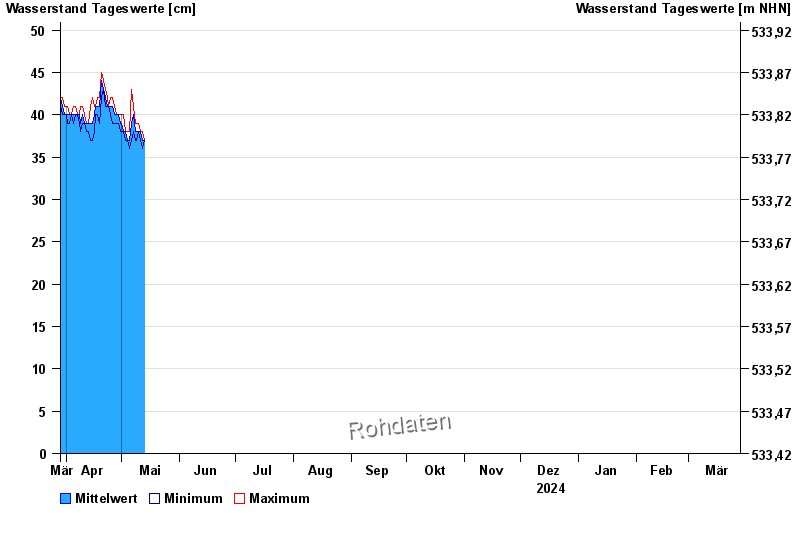
| Datum | Mittelwert [cm] | Maximum [cm] | Minimum [cm] |
|---|---|---|---|
| 28.04.2024 | 40 | 40 | 39 |
| 27.04.2024 | 40 | 41 | 39 |
| 26.04.2024 | 41 | 42 | 39 |
| 25.04.2024 | 41 | 42 | 40 |
| 24.04.2024 | 41 | 41 | 41 |
| 23.04.2024 | 41 | 42 | 41 |
| 22.04.2024 | 42 | 43 | 41 |
© Bayerisches Landesamt für Umwelt 2024