
- Startseite >
- Flüsse >
- Wasserstand >
- Obere Donau >
- Hasberg >
- Jahresgrafik

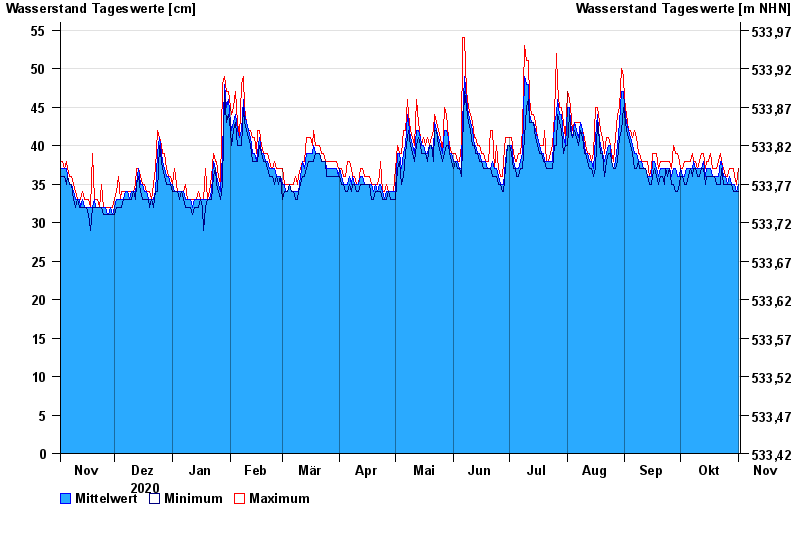
Jahresgrafik Hasberg / Östliche Mindel
Wasserstand vom 02.11.2020 bis zum 01.11.2021
- 07.06.2002 Wasserstand: 120 cm
- 08.06.1971 Wasserstand: 102 cm
- 11.08.2002 Wasserstand: 100 cm
- 23.08.2005 Wasserstand: 97 cm
- 14.04.1994 Wasserstand: 95 cm
| Datum | Mittelwert [cm] | Maximum [cm] | Minimum [cm] |
|---|---|---|---|
| 01.11.2021 | 35 | 37 | 34 |
| 31.10.2021 | 34 | 35 | 34 |
| 30.10.2021 | 35 | 36 | 34 |
| 29.10.2021 | 35 | 37 | 34 |
| 28.10.2021 | 35 | 37 | 35 |
| 27.10.2021 | 36 | 37 | 35 |
| 26.10.2021 | 35 | 36 | 35 |
© Bayerisches Landesamt für Umwelt 2024