
- Startseite >
- Flüsse >
- Wasserstand >
- Obere Donau >
- Harburg >
- Jahresgrafik

Jahresgrafik Harburg / Wörnitz
Wasserstand vom 02.03.2021 bis zum 01.03.2022
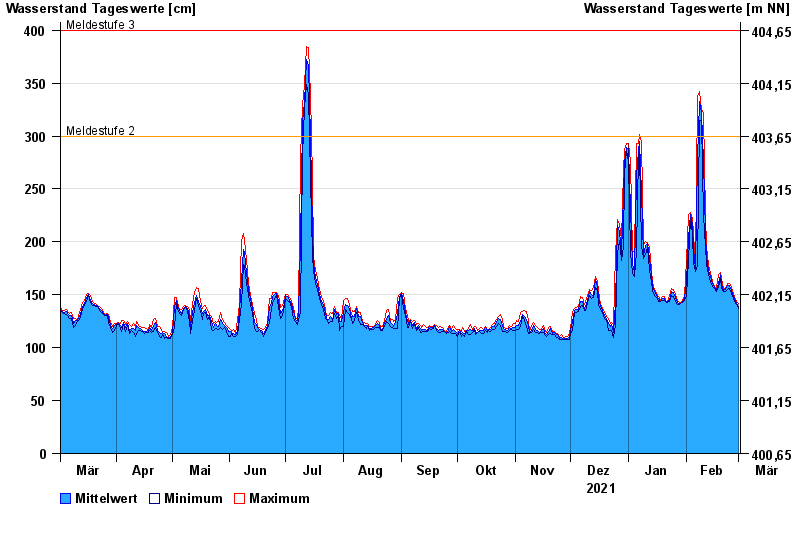
- Meldestufe 2 300 cm
- Meldestufe 3 400 cm
- Meldestufe 4 480 cm
- Hochwassergefahrenfläche HQ100 580 cm
- Hochwassergefahrenfläche HQhäufig 500 cm
| Datum | Mittelwert [cm] | Maximum [cm] | Minimum [cm] |
|---|---|---|---|
| 01.03.2022 | 139 | 142 | 137 |
| 28.02.2022 | 142 | 144 | 141 |
| 27.02.2022 | 146 | 148 | 144 |
| 26.02.2022 | 148 | 151 | 146 |
| 25.02.2022 | 154 | 157 | 151 |
| 24.02.2022 | 159 | 161 | 156 |
| 23.02.2022 | 159 | 161 | 155 |
© Bayerisches Landesamt für Umwelt 2024