
- Startseite >
- Flüsse >
- Wasserstand >
- Obere Donau >
- Gerlenhofen >
- Jahresgrafik

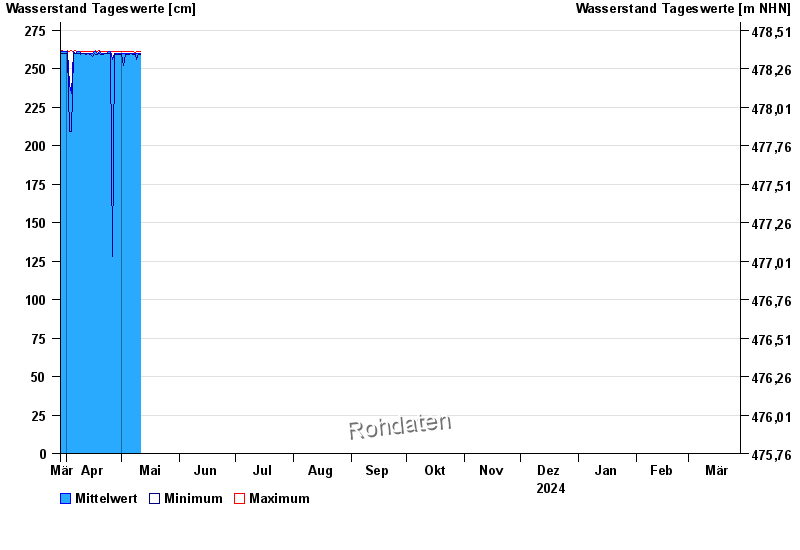
Jahresgrafik Gerlenhofen / Illerkanal
Wasserstand vom 29.03.2024 bis zum 28.03.2025
| Datum | Mittelwert [cm] | Maximum [cm] | Minimum [cm] |
|---|---|---|---|
| 15.05.2024 | 251 | 251 | 250 |
| 14.05.2024 | 251 | 254 | 248 |
| 13.05.2024 | 253 | 260 | 248 |
| 12.05.2024 | 260 | 261 | 259 |
| 11.05.2024 | 260 | 261 | 259 |
| 10.05.2024 | 260 | 261 | 260 |
| 09.05.2024 | 260 | 261 | 256 |
© Bayerisches Landesamt für Umwelt 2024