
- Startseite >
- Flüsse >
- Wasserstand >
- Obere Donau >
- Fürstenfeldbruck >
- Jahresgrafik

Jahresgrafik Fürstenfeldbruck / Amper
Wasserstand vom 01.04.2023 bis zum 31.03.2024
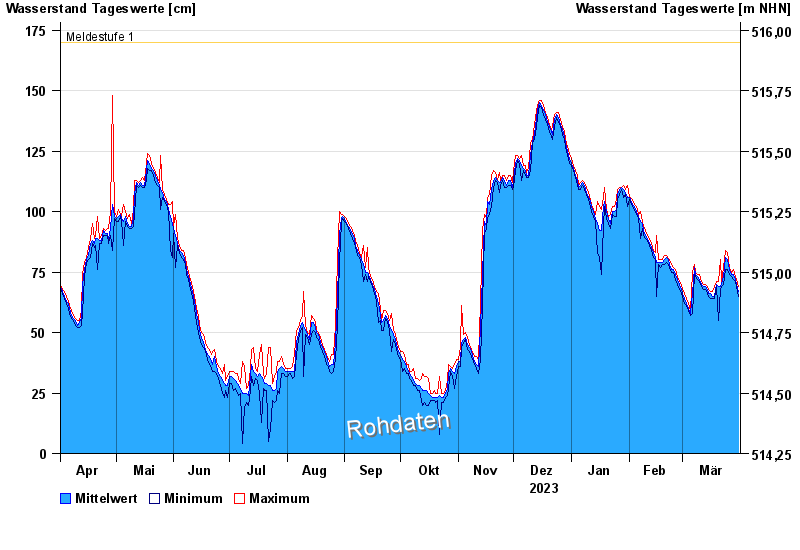
- Meldestufe 1 170 cm
- Meldestufe 2 210 cm
- Meldestufe 3 220 cm
- Meldestufe 4 250 cm
| Datum | Mittelwert [cm] | Maximum [cm] | Minimum [cm] |
|---|---|---|---|
| 31.03.2024 | 67 | 69 | 65 |
| 30.03.2024 | 70 | 72 | 69 |
| 29.03.2024 | 72 | 73 | 71 |
| 28.03.2024 | 74 | 76 | 72 |
| 27.03.2024 | 74 | 75 | 73 |
| 26.03.2024 | 76 | 77 | 74 |
| 25.03.2024 | 80 | 83 | 76 |
© Bayerisches Landesamt für Umwelt 2024