
- Startseite >
- Flüsse >
- Wasserstand >
- Obere Donau >
- Fürstenfeldbruck >
- Jahresgrafik

Jahresgrafik Fürstenfeldbruck / Amper
Wasserstand vom 01.01.2024 bis zum 31.12.2024
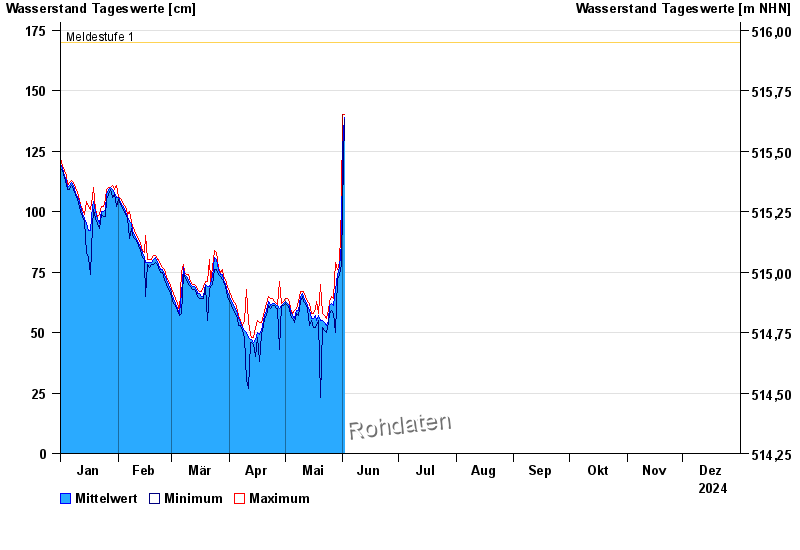
- Meldestufe 1 170 cm
- Meldestufe 2 210 cm
- Meldestufe 3 220 cm
- Meldestufe 4 250 cm
| Datum | Mittelwert [cm] | Maximum [cm] | Minimum [cm] |
|---|---|---|---|
| 10.05.2024 | 66 | 67 | 65 |
| 09.05.2024 | 65 | 67 | 63 |
| 08.05.2024 | 59 | 63 | 57 |
| 07.05.2024 | 59 | 60 | 58 |
| 06.05.2024 | 56 | 59 | 54 |
| 05.05.2024 | 57 | 58 | 56 |
| 04.05.2024 | 59 | 60 | 57 |
© Bayerisches Landesamt für Umwelt 2024